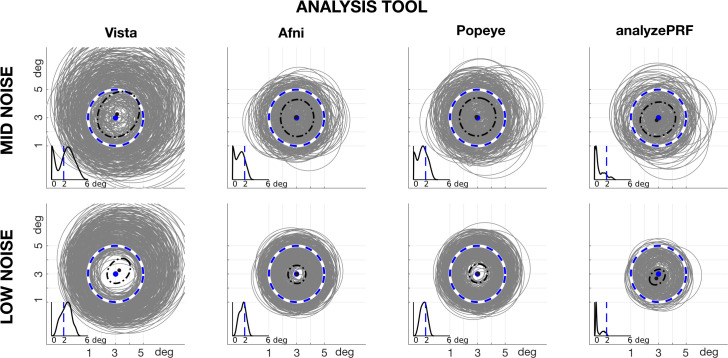
Fig 8. HRF variation.
The synthesized circular pRF was centered at (3,3) deg with a radius of 2 deg. The data were simulated with prf-Synthesize 400 times, and each time using one of the four prf-Analyze HRFs to synthesize the data. The estimated circular pRFs (gray circles) were calculated using the default HRF implemented in each tool. Outliers are eliminated by showing only fits within the 90th percentile of the pRF size estimates. The inset shows the probability distribution of the pRF sizes, where the blue vertical line shows the ground truth (2 deg).

