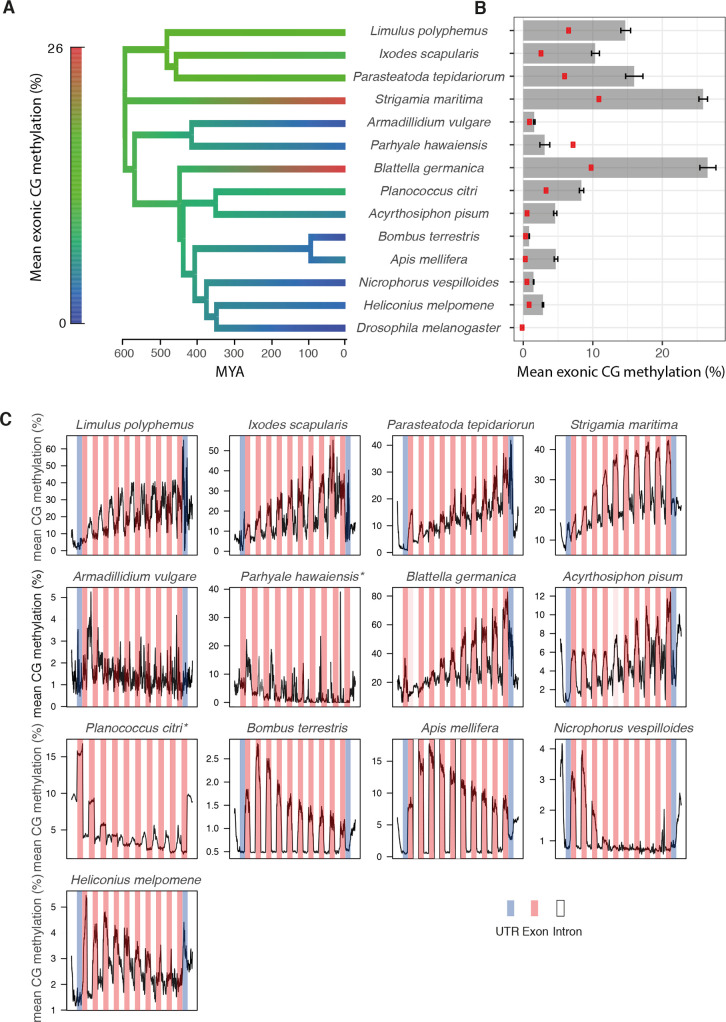
Fig 3. Gene body methylation.
(A) Ancestral state reconstruction of the mean % methylation of CpGs within exons. (B) Mean % methylation of CpGs within exons with 95% bootstrap confidence intervals. Red points are CpGs >1kB from annotated regions of the genome. (C) Metagene plot of methylation across introns (white), exons (pink), UTRs (blue) and 1kB of flanking sequence (white).

