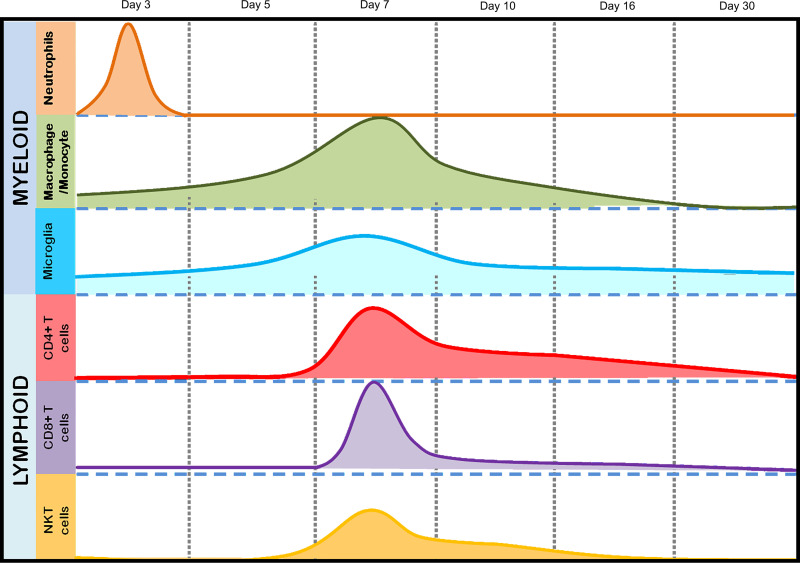
FIG 1.
Temporal immune cell kinetics in the brains of RSA59-infected mice. The results from flow-cytometric analysis of the migration of inflammatory cells and CNS-resident cells from RSA59-infected mice are summarized in the schematic diagram. The diagram represents the differential infiltration of total myeloid (neutrophils, macrophages/monocytes, and microglia) and lymphoid (CD4, CD8, and NKT) cell populations at days 3, 5, 7, 10, 16, and 30 p.i. The peaks show the highest infiltration at the respective times postinfection. The scale is arbitrary.

