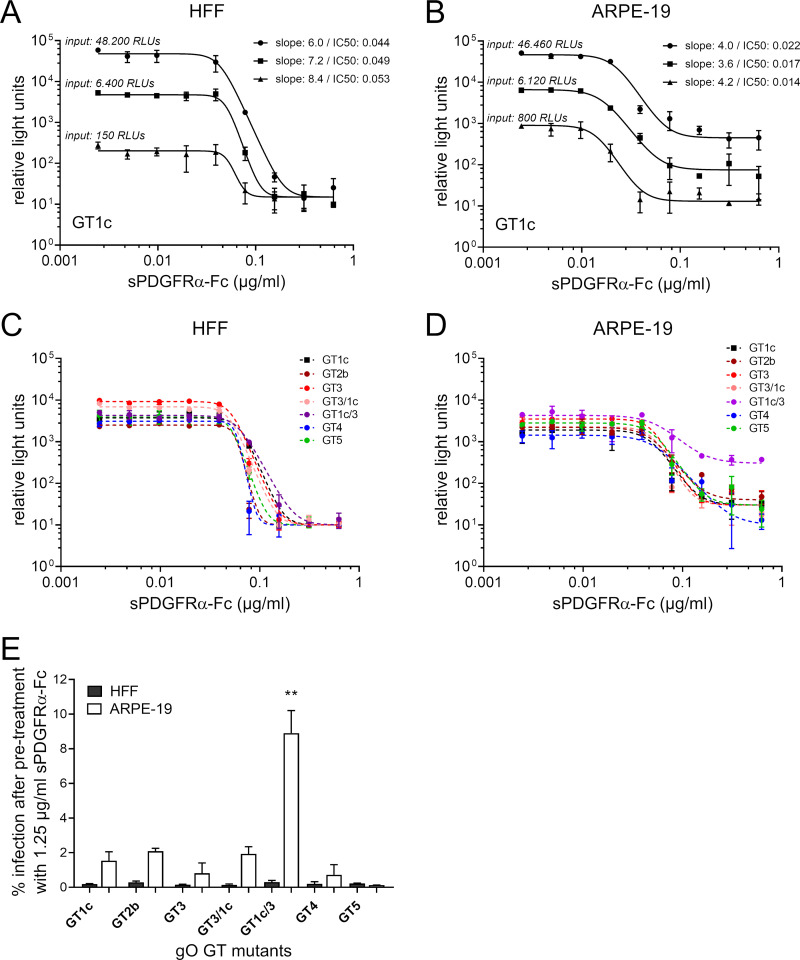
FIG 4.
Inhibition of cell-free infectivity of gO genotype mutant viruses by soluble PDGFRα-Fc. The whole panel of gO genotype (GT) mutants along with the parental strain gO GT1c was preincubated with soluble PDGFRα-Fc (sPDGFRα-Fc) before infection of human foreskin fibroblasts (HFFs) or ARPE-19 (adult retinal pigment epithelial cell line 19) cells. Two days after infection, counts of relative light units (RLUs) were determined in cell lysates by a luciferase assay. (A and B) Three different virus stock concentrations of the parental strain gO GT1c (MOI of 0.01 to 0.5 on HFFs and MOI 0.002 to 0.04 on ARPE-19 cells), indicated as input RLU values, were used. (C and D) Mutant virus stocks were diluted to achieve RLU values ranging from 2,600 to 9,000 without treatment in HFFs (MOI of 0.05 to 0.1 on HFFs) and from 1,600 to 5,000 without treatment in ARPE-19 cells (MOI of 0.003 to 0.01 on ARPE cells). In the experiments shown in panels A to D, parental and mutant virus stocks were treated with serial 2-fold dilutions of sPDGFRα-Fc (range, 0.625 to 0.0244 μg/ml). Monitored RLU values were plotted against sPDGFRα-Fc concentrations. Four-parameter dose-response curves were generated, and the protein concentration causing 50% inhibition of infection (IC50) and the steepness of the curves were calculated (Table 2). In panels C and D, one representative curve from each mutant out of 2 to 4 independent experiments is shown. Data represent mean values ± standard deviations of triplicate determinations. (E) The percentage of infection of HFFs or ARPE-19 cells after pretreatment with 1.25 μg/ml sPDGFRα-Fc is shown. Input infectivity without treatment ranged from 2,500 to 13,700 RLUs in HFFs (MOI of 0.05 to 0.2) and from 1,400 to 8,000 RLUs in ARPE-19 cells (MOI of 0.003 to 0.015). Experiments were performed in triplicates, and data are means ± standard errors of the means of 3 to 4 independent experiments. Statistical significance was evaluated by ANOVA with Tukey’s test for multiple comparison (**, P < 0.01, for results in comparison to those with GT1c).

