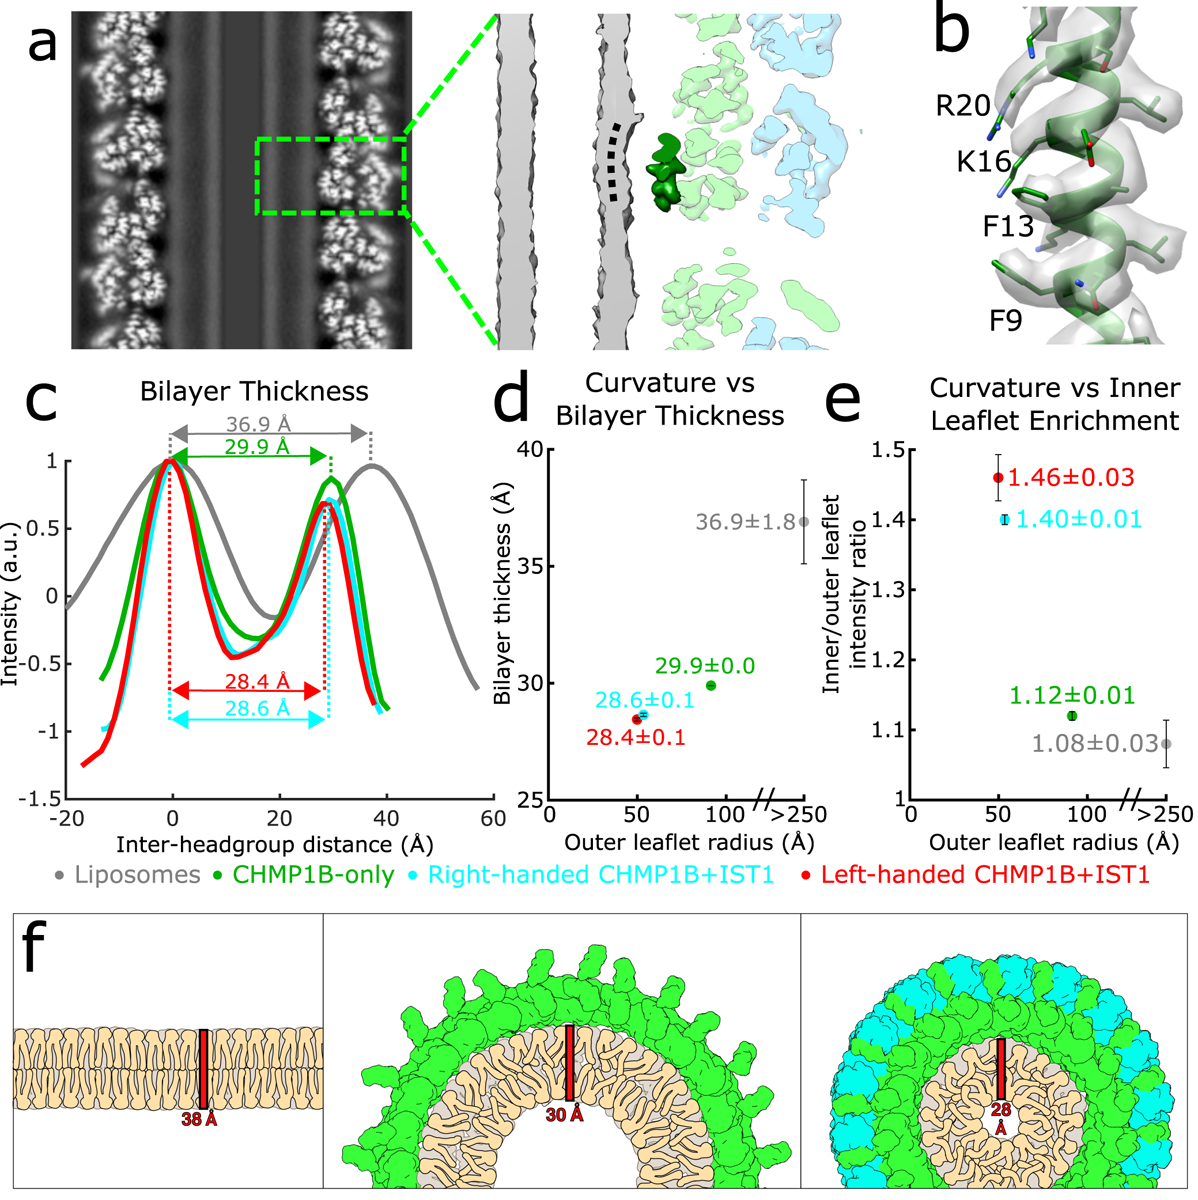
Fig. 4. The bilayer thins and the inner leaflet crowds under high curvature in the CHMP1B+IST1 filament.

a, The outer leaflet dimples under extreme curvature in the membrane-bound CHMP1B+IST1 filament. Left, central slice along the helical axis of the CHMP1B+IST1 tubule. Right, zoomed view of boxed area in left showing CHMP1B dimpling (black dashed curved line) in the outer leaflet of the bilayer. A CHMP1B helix α1 sitting at the membrane is highlighted in dark green. b, CryoEM density map and model of CHMP1B helix α1 from (a). The residues involved in membrane binding are labeled. c, Intensity plots of membrane bilayer thickness for liposomes only (from 2D class averages, colored in grey), membrane-bound CHMP1B (green), and right- or left-handed membrane-bound CHMP1B+IST1 filaments (cyan and red respectively) as determined by cryoEM. The bilayer thickness is labeled for each. Intensities were normalized to the peak intensity of the inner leaflet. d, Plot of membrane thickness as a function of radius of the outer leaflet. The dots are colored as in (left). e, The inner membrane density increases as a function of curvature. Plot of ratio of inner leaflet to outer leaflet peak intensity as a function of radius of the outer leaflet. Dots are labeled as in (c). For (c-e), data are mean ± s.d. and the liposome values were determined from 2D averages (n=6) while the others were determined from half maps from each 3D reconstruction (n=2). f, Schematic illustration of lipid behavior as the bilayer is remodeled from planar (left), to moderate curvature by CHMP1B (middle), to high curvature by CHMP1B+IST1 (right). The outer leaflet headgroups spread out, while the inner leaflet headgroups crowd and the aliphatic tails become more disordered and therefore less extended.
