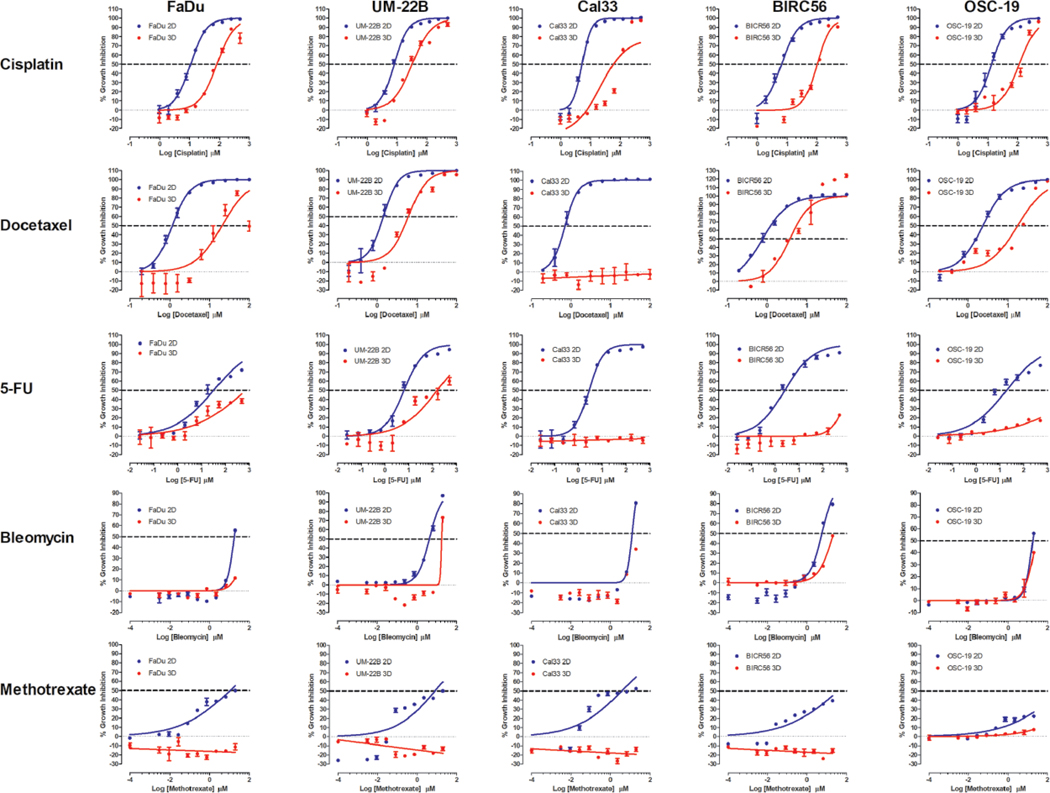
Figure 1.
2D monolayer and MCTS CTB GI curves for FDA-approved HNSCC drugs. For 2D monolayer cultures, the five HNSCC cell lines were seeded into 384-well assay plates and cultured for 24 h before they were exposed to the indicated concentrations of cisplatin, docetaxel, 5-FU, bleomycin, or methotrexate for 72 h prior to the addition of the CTB and measurement of the RFU signals. For MCTS cultures, the five HNSCC cell lines were seeded in 384-well ULA-plates, and after 3 days in culture, the MCTSs were exposed to the indicated concentrations of the drugs for 72 h prior to the addition of CTB and measurement of the RFU signals. The mean maximum (0.5% DMSO) and minimum (200 μM doxorubicin + 0.5% DMSO) plate control CTB RFUs were used to normalize the RFU data from the compound treated wells as percent inhibition of growth and the GI50 data were fitted to a nonlinear sigmoidal log inhibitor concentration versus the normalized response variable slope model using the GraphPad Prism 6 software. The normalized mean ± SD (n = 3) GI data from triplicate wells for each compound concentration are presented. The data and curve fits for 2D monolayer (●) and MCTS (●) cultures are indicated in blue and red, respectively. Representative experimental data from one of three or four independent experiments are shown.

