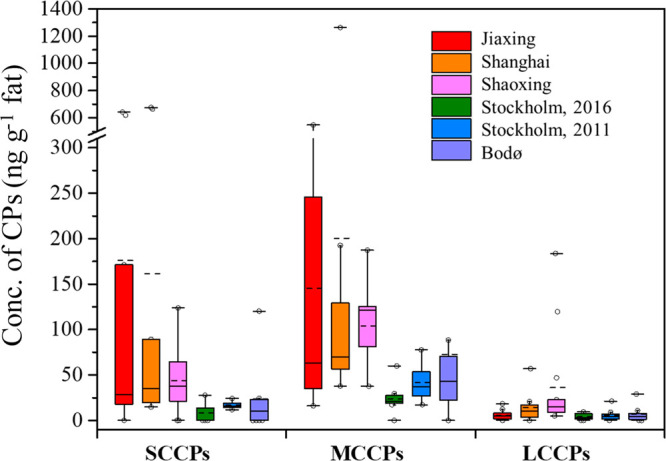
Figure 1.

Box and whisker plot (extended to 10th and 90th percentile) of SCCP, MCCP, and LCCP concentrations (ng g–1 fat) in human milk from Jiaxing (n = 13, 2015–2019), Shanghai (n = 10, 2015–2019), and Shaoxing (n = 13, 2010) in China, Stockholm (n = 10 in 2011 and n = 9 in 2016) in Sweden, and Bodø (n = 8, 2014) in Norway. The dash line represents the mean concentration.
