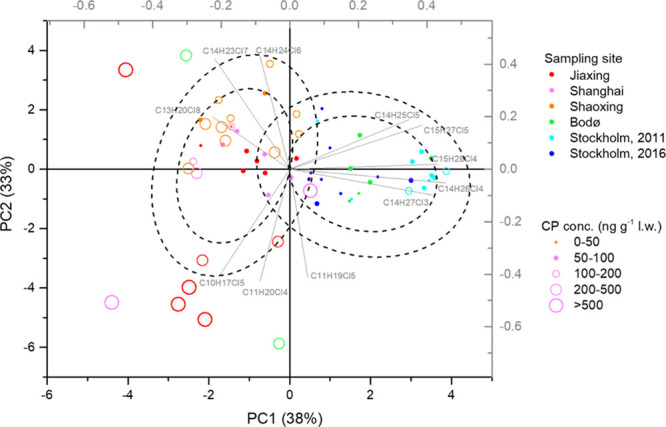
Figure 3.

PCA of relative abundances of 11 selected CP congener groups in human milk from Jiaxing (2015–2016), Shanghai (2015–2016), Shaoxing (2010), Stockholm (2011 and 2016), and Bodø (2014). The left dotted circles represent the 75 and 50% confidence intervals of the normal distribution for Scandinavian samples, respectively, as also the right dotted circles for the Chinese samples.
