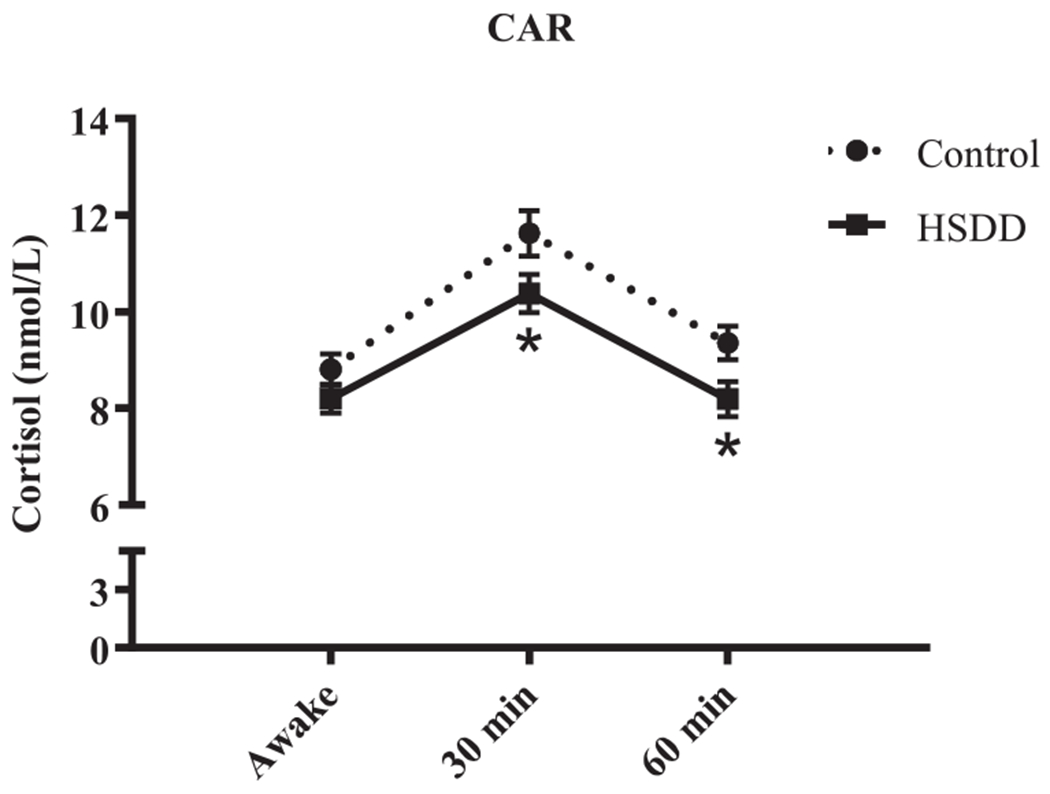
Fig. 3.

Cortisol awakening response (CAR). Salivary cortisol levels at awakening (awake), and 30 min and 60 min after waking are shown (mean ± SEM). The “*” indicates a significant post-hoc comparison to the control group at the indicated time point (p < .05). In addition, both the average CAR and area under the curve (AUC) are lower in HSDD compared to control participants (p < .05).
