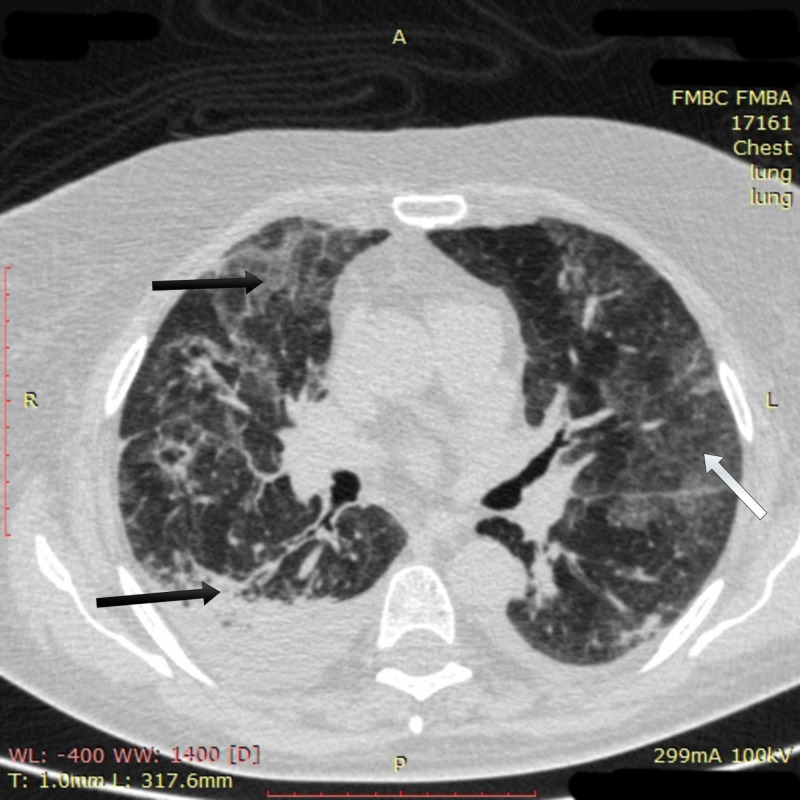
Figure 3. Chest CT imaging of patient 1 on day 17.
Chest CT on day 17 showed multiple confluent ground-glass opacities had increased in size (white arrow); bilateral pulmonary infiltrates had lost their density to the degree of ground-glass opacity, and their area had decreased (black arrows)
CT: computed tomography

