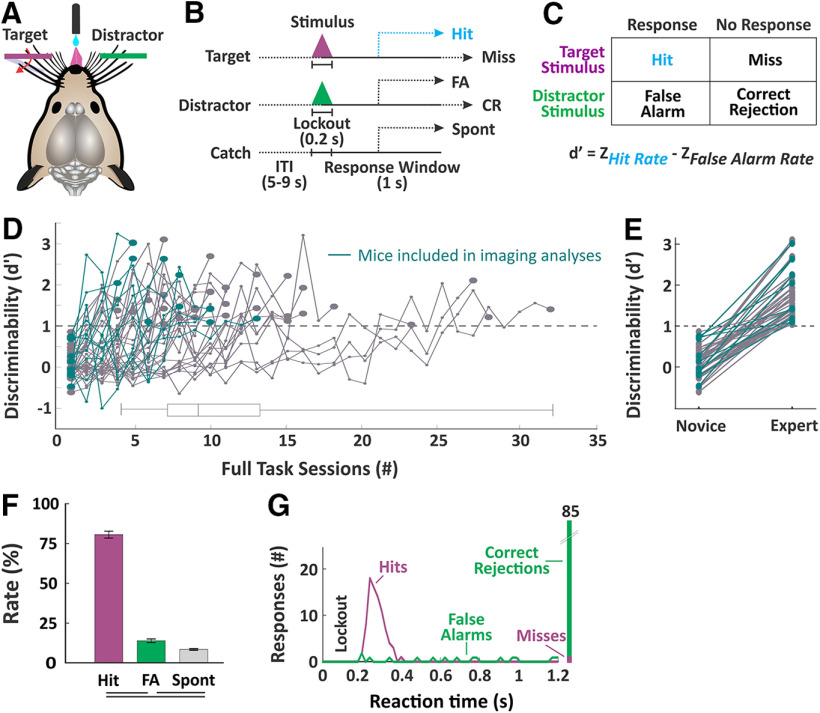
Figure 2.
Behavior paradigm and measures of selective detection. A, Illustration of the behavioral setup. Mice are head-fixed in the behavioral rig with piezo-controlled paddles within their whisker fields bilaterally. Each paddle is assigned as target (purple) or distractor (green) at the start of training. Mice report stimulus detection and receive rewards from a central lickport. B, Task structure. Each trial consists of an intertrial interval, a stimulus and 200-ms lockout, and a 1-s response window. Trial type as determined by the stimulus could be target, distractor or catch (no stimulus). C, Calculation of discriminability d', as the separation between hit rate and false alarm rate. D, Performance trajectories for all mice (n = 43 mice) and box and whiskers summary plot. Those used for imaging studies (n = 5 mice) are indicated in teal. Mice were considered expert once they achieved a d' > 1 for three consecutive days. E, Comparison of d' for novice mice (first day of training on impulse control) and expert mice (n = 43 mice, paired sample t test, p = 3.7e−20, t(42) = 16.71). F, Performance measures for the imaging sessions (n = 39 sessions). Lines below plot denote statistical significance. G, Example session data showing reaction time distributions for target and distractor trials.

