
Figure 3.
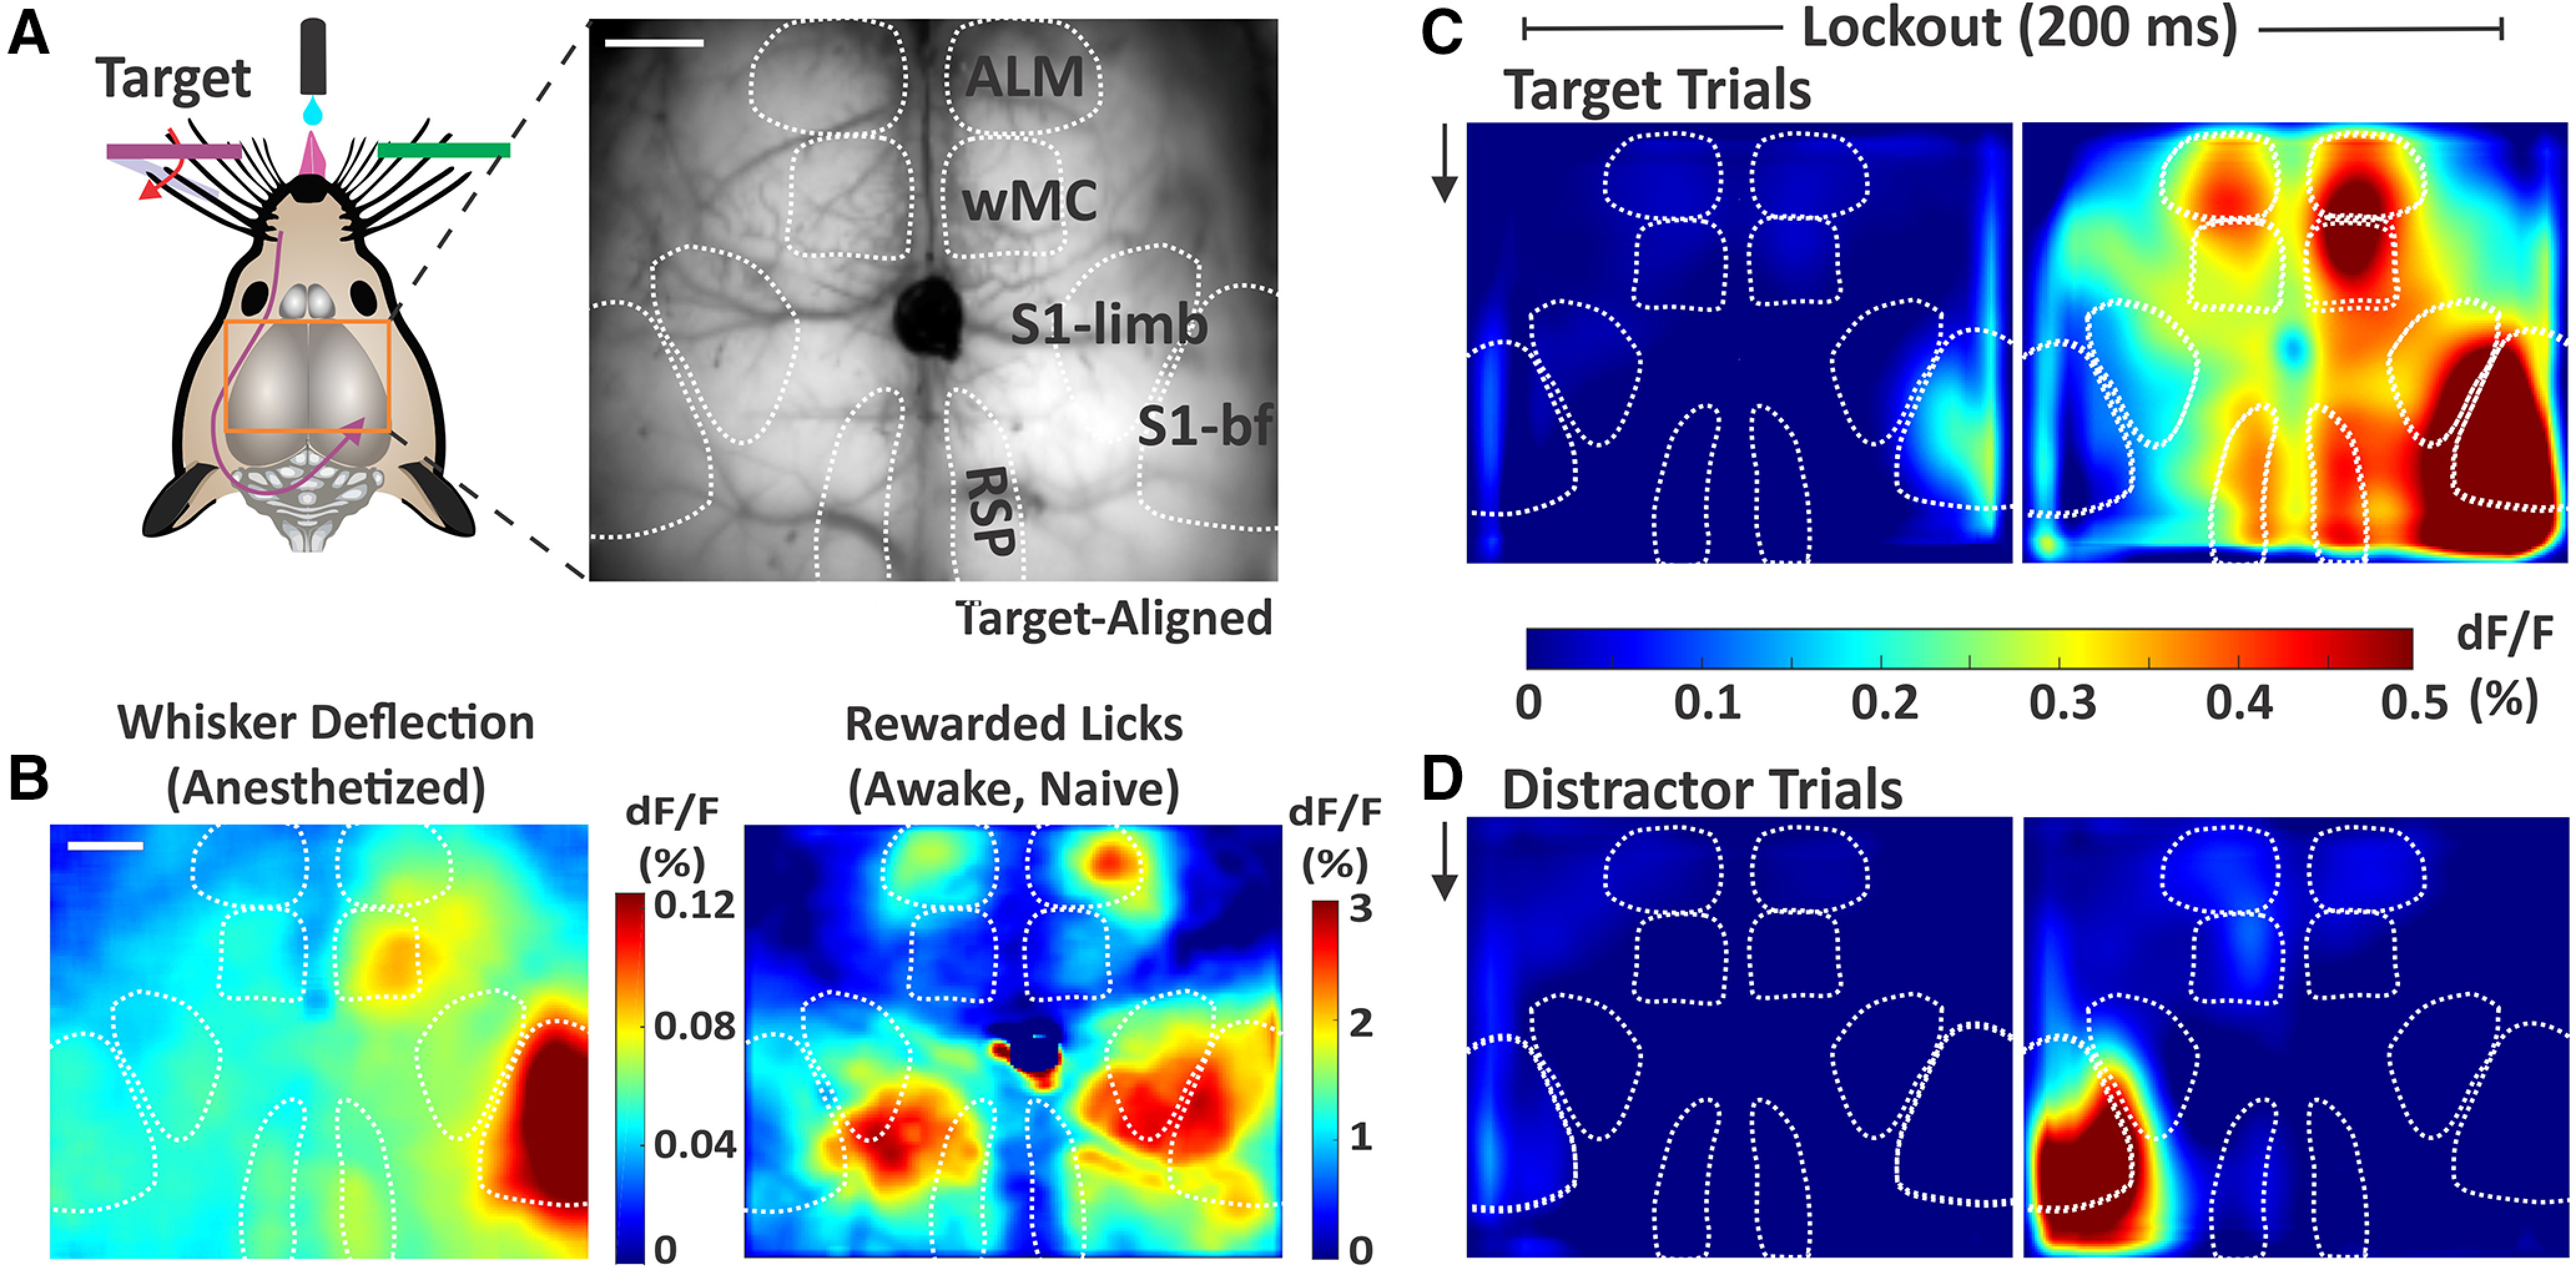
Sensory and motor cortical representations using widefield Ca2+ imaging. A, Illustration of the imaging setup (left) and example frame from the through-skull GCaMP6s imaging (right). Surface vessels appear as dark striations overlaying the brain parenchyma. Bregma is indicated by the central ink blot. bf, barrel field. B, Cortical activity (dF/F) following whisker deflections in an anesthetized mouse (left), to localize of the sensory and motor whisker representations. Cortical activity following reward-triggered licking in a naive mouse (right), to localize licking-related activity. C, Cortical activity on target trials during the two sequential imaging frames of the lockout period in expert mice performing the detection task (grand average, n = 39 sessions). Black arrow indicates whisker stimulus onset, which is coincident with the start of the first imaging frame. D, Same as C, but for distractor trials. Note the differential propagation of cortical activity depending on trial type. Scale bars in A, B, 1 mm.