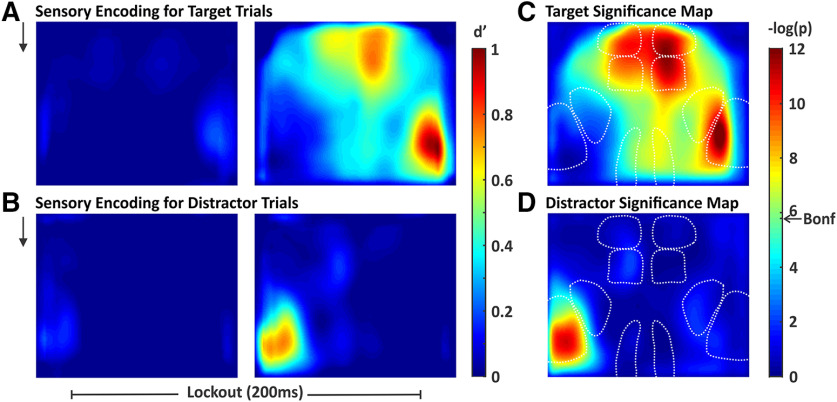
Figure 5.
Spatial maps of stimulus encoding. We quantified stimulus encoding as the separation between stimulus absent and stimulus present d', computed pixel-by-pixel. A, Map of target stimulus encoding during the two sequential frames of the lockout period (black arrow represents stimulus onset). B, Map of distractor stimulus encoding during the same time windows as in A. C, D, Significance maps of the right panels of A, B, respectively. Significance threshold determined by the Bonferroni correction for multiple comparisons is indicated by the arrow on the color bar (Bonf). Pixels with smaller p values (warmer colors) have d' values significantly above 0. For target stimuli, we observed widespread stimulus encoding including in multiple frontal and parietal regions. For distractor stimuli, significant stimulus encoding is restricted to S1.

