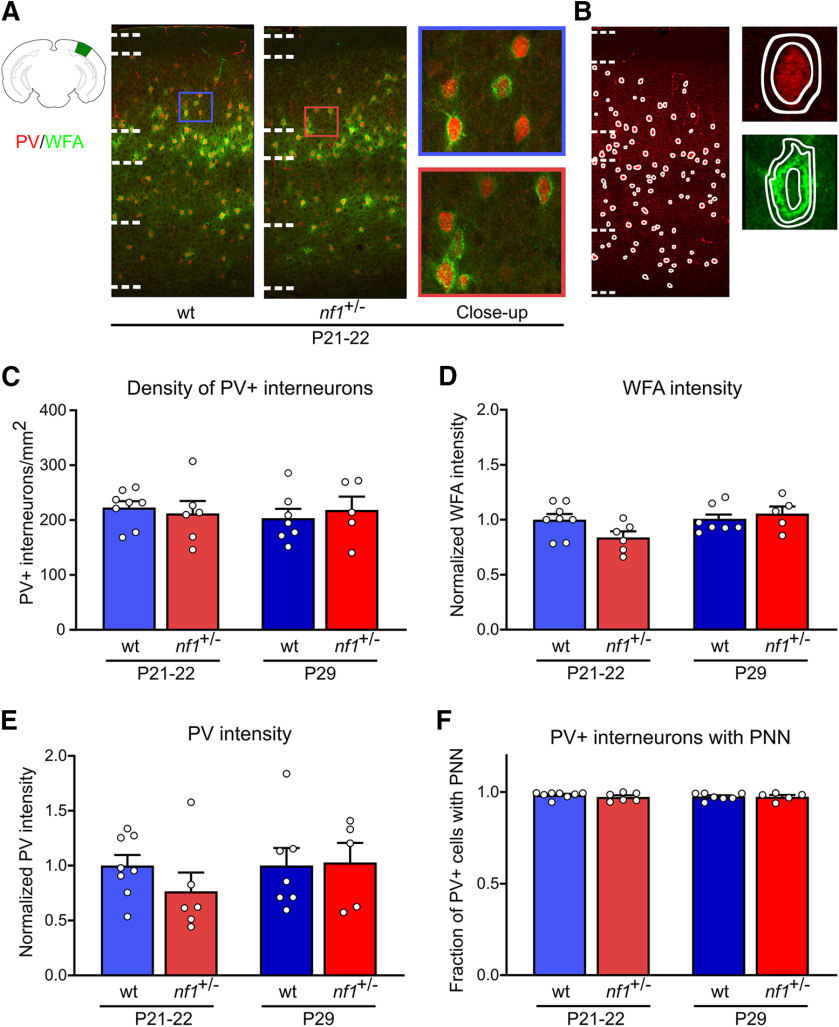
Figure 6.
No changes in maturation markers of PV+ neurons at the onset and peak of the critical period. A, Immunohistochemical examples of PNNs in green and PV+ interneurons of WT and nf1+/− mice at the onset (P21–P22). The schematic representation of the location of V1 was adapted from the Allen Brain Atlas. B, Left, Example ROIs used for the quantification of the PV+ interneurons density. Top right, example ROI used for the measurement of PV intensity (inner circle) and the surrounding background (between inner and outer circle). Bottom right, Example ROI used for the measurement of WFA intensity (between inner and middle circle) and the surrounding background (between middle and outer circle). C, The number of PV+ interneurons per mm2 did not differ between WT and nf1+/− mice at P21–P22 (t test, p = 0.66; WT: n = 8 mice, nf1+/−: n = 6) or P29 (t test, p = 0.61; WT: n = 7, nf1+/−: n = 5) (for the distribution of PV+ interneurons per cortical layer, see Extended Data Figure 6-1A). D, At P21–P22, WFA intensity around PV+ interneurons in V1 appeared to be slightly lower in nf1+/− mice but did not differ significantly from WT mice (t test, p = 0.06; WT: n = 8 mice, nf1+/−: n = 6). No difference was observed at P29 (Mann–Whitney, p = 0.50; WT: n = 7, nf1+/−: n = 5) (for WFA intensity per layer, see Extended Data Figure 6-1C). E, PV intensity showed a similar pattern with a nonsignificant trend toward lower expression in nf1+/− mice at P21–P22 (t test, p = 0.23; WT: n = 8 mice, nf1+/−: n = 6), which was absent at P29 (t test, p = 0.91; WT: n = 7, nf1+/−: n = 5). The PV and WFA intensities were normalized by dividing the signal by the average intensity across the age-matched WT mice. Extended Data Figure 6-1B shows the PV intensity per layer. F, The fraction of PV+ interneurons enwrapped by a PNN in V1 was similar betweennf1+/− mice and WT littermates at P21–P22 (Mann–Whitney, p = 0.57; WT: n = 8, nf1+/−: n = 6) and P29 (Mann–Whitney, p > 0.99; WT: n = 7, nf1+/−: n = 5) (for fraction of PV+ interneurons with PNN per layer, see Extended Data Figure 6-1D).

