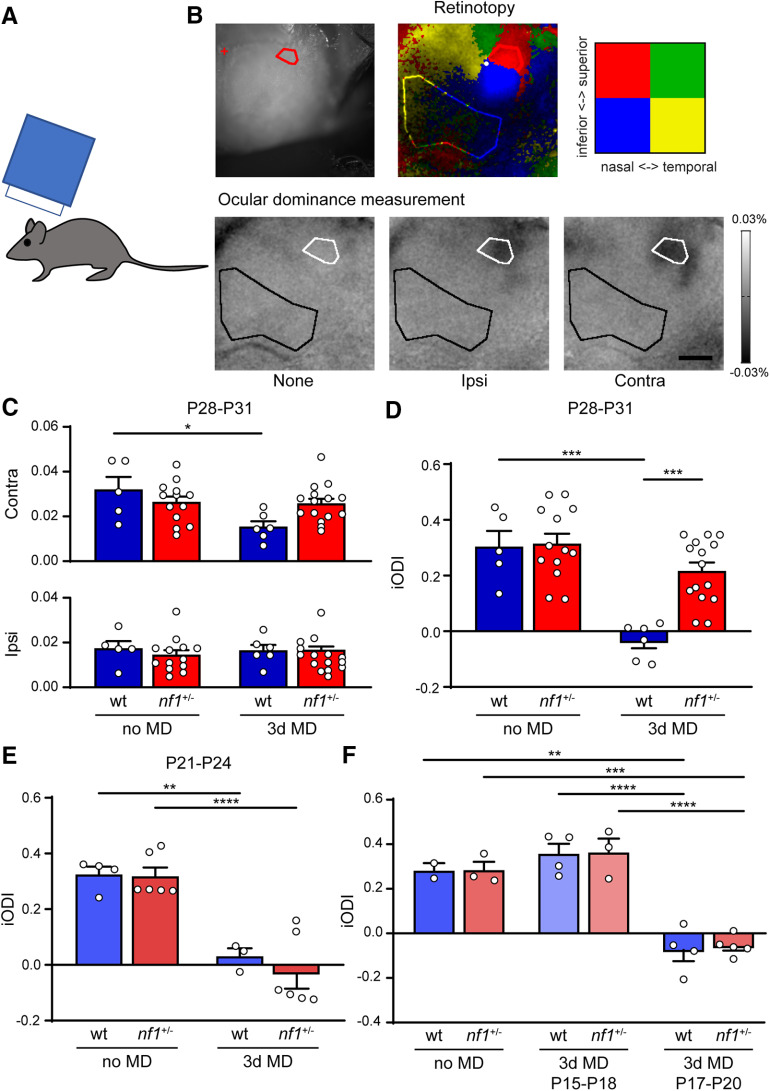
Figure 7.
Precocious closure but normal onset of the critical period of plasticity in V1 of nf1+/− mice. A, Schematic illustration of experimental approach. To determine OD plasticity in mice, optical imaging of intrinsic signal is used in mice during the peak of the critical period, or around its onset. B, Top, Example of a cranial image and retinotopy created by visual stimulation with 2 × 2 patches of drifting gratings. The upper nasal part is used as an ROI, and an area outside V1 as a reference for the OD measurements. Bottom, Transcranial images of change in light reflection in V1, in response to individual eye stimulation in a nondeprived mouse. C, Absolute change in responses to input from the contralateral or ipsilateral eye. Three day MD at P28-P31 causes a loss of deprived, contralateral eye responses in WT, but not nf1+/− mice (two-way ANOVA, F(1,35) = 6.03, p = 0.02, post hoc Tukey's, no MD WT vs 3d MD WT: p = 0.02; no MD nf1+/− vs 3d MD nf1+/−: p = 0.998; 3d MD WT vs 3d MD nf1+/−: p = 0.10), whereas nondeprived, ipsilateral eye responses remain the same (two-way ANOVA, F(1,35) = 0.41, p = 0.53; WT no MD: n = 5 mice, nf1+/− no MD: n = 13 mice, WT 3d MD: n = 6 mice, nf1+/− 3d MD: n = 15 mice). D, iODI is calculated from the data in C and is defined by the following: (contralateral response – ipsilateral response)/(contralateral response + ipsilateral response). iODI shows that 3d MD at P28-P31 induces a larger OD shift in WT mice than in nf1+/− mice (two-way ANOVA, F(1,35) = 8.58, p = 0.006, post hoc Tukey's, WT no MD vs WT 3d MD, p = 0.0001, nf1+/− no MD vs nf1+/− 3d MD, p = 0.4720, WT 3d MD vs nf1+/− 3d MD, p = 0.0004). E, iODI shows that 3d MD between P21 and P24 induces a full OD shift in both WT and nf1+/− mice (two-way ANOVA, 3d MD effect, F(1,15) = 52.12, p < 0.0001, post hoc Tukey's, WT no MD vs WT 3d MD, p = 0.004, nf1+/− vs nf1+/− 3d MD, p < 0.0001, WT 3d MD vs nf1+/− 3d MD, p = 0.82, WT no MD: n = 4 mice, nf1+/− no MD: n = 6, WT 3d MD: n = 3, nf1+/− 3d MD: n = 6). F, iODI shows that 3d MD between P17 and P20 induces a full OD shift in both WT and nf1+/− mice, whereas no OD shift occurs 2 d earlier between P15 and P18 (two-way ANOVA, 3d MD effect, F(2,15) = 60.86, p < 0.0001, post hoc Tukey's, WT: no MD vs 3d MD P15-P18, p = 0.88, nf1+/−: no MD vs 3d MD P15-P18, p = 0.83, WT: no MD vs 3d MD P17-P20, p = 0.002, nf1+/−: no MD vs 3d MD P17-P20, p = 0.0004, WT: 3d MD P15-P18 vs 3d MD P17-P20, p < 0.0001, nf1+/−: 3d MD P15-P18 vs 3d MD P17-P20, p < 0.0001, WT no MD: n = 2 mice, nf1+/− no MD: n = 3, WT P15-P18: n = 4, nf1+/− P15-P18: n = 3, WT P17-P20: n = 4, nf1+/−). *p < 0.05, **p < 0.01, ***p < 0.001, ****p < 0.0001.

