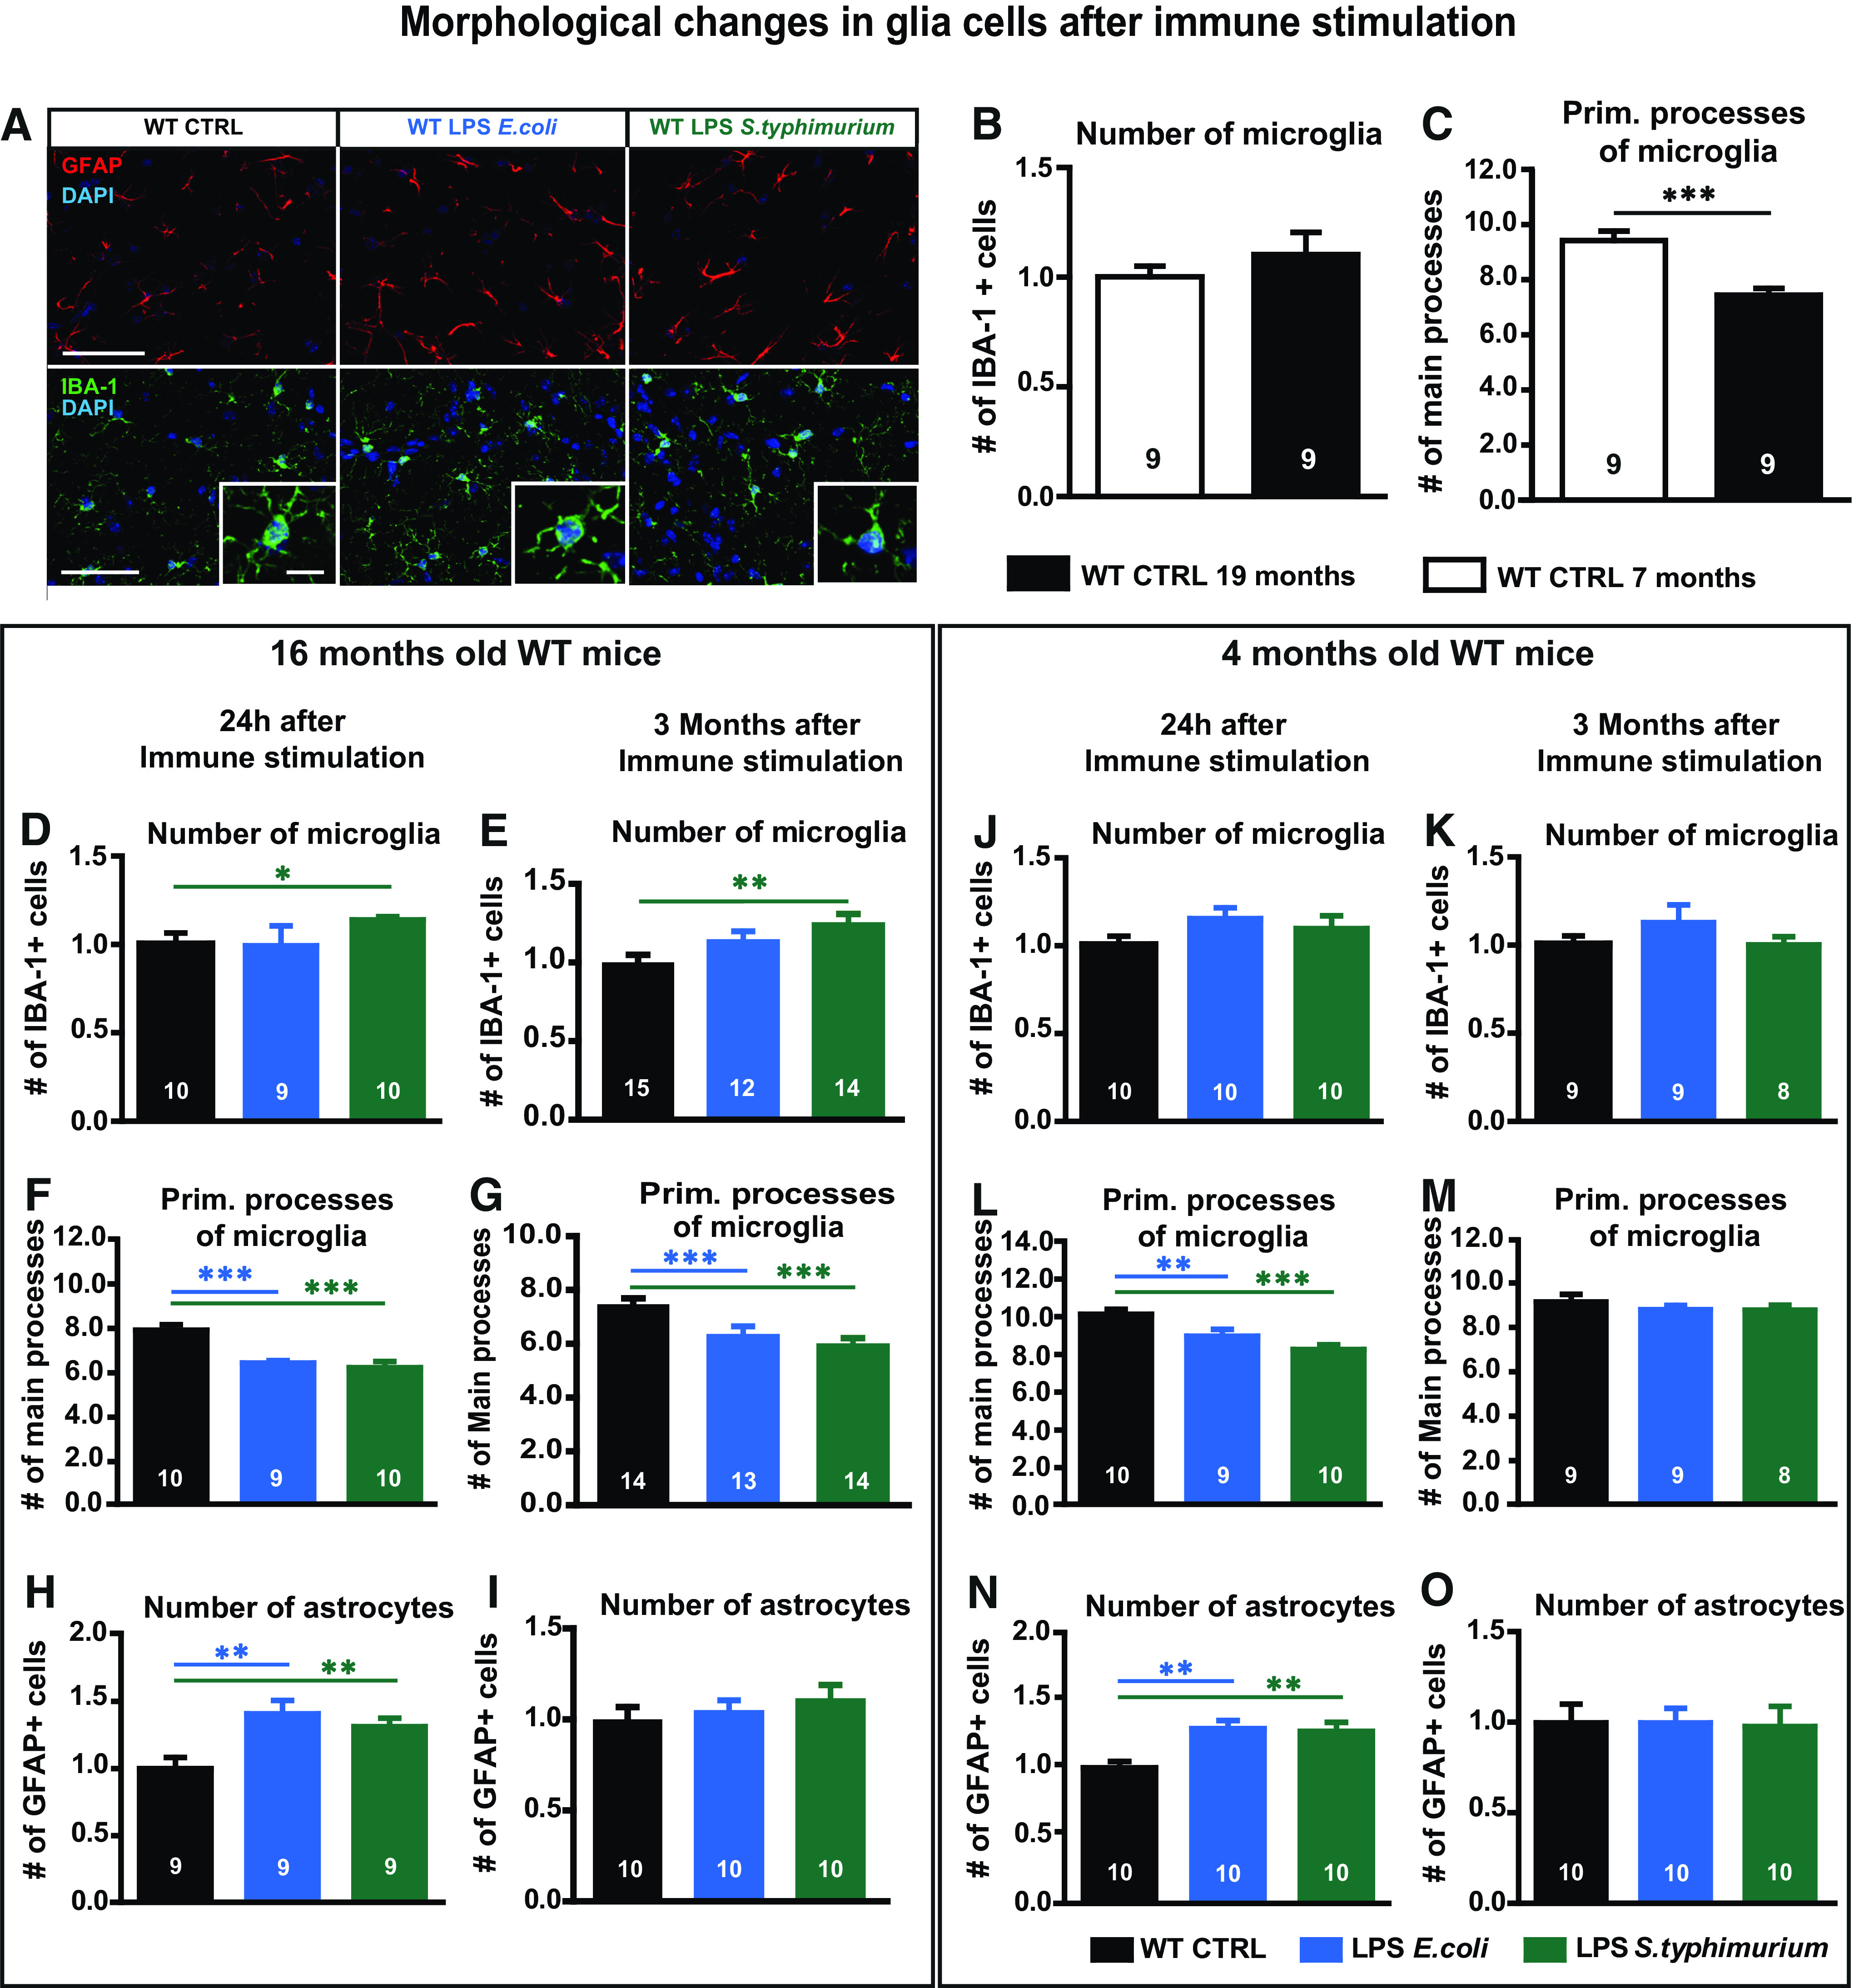
Figure 2.

Astrocyte and microglia phenotype of adult and aged WT mice after immune stimulation with 0.4 µg/g bodyweight LPS of E. coli or S. typhimurium. A, Immunohistochemical staining of GFAP (red) and IBA-1 (green) in the CA1 stratum radiatum in overlay with DAPI (blue), scale bar large frame 100 µm, smaller detail 10 µm. B, Relative number of IBA-1-positive cells of control-injected adult (seven months, white bar) and aged mice (16–19 months, black bar), normalized to adult controls. C, Quantification of primary branches of IBA-1-positive cells of control-injected adult and aged mice (seven vs 16–19 months). D, E, J, K, Relative number of IBA-1-positive cells of immune-stimulated mice (LPS E. coli blue, LPS S. typhimurium green) compared with aged controls (black), 24 h (D), and three months (E) after immune stimulation and in adult mice after 24 h (J), three months (K), normalized to respective controls. F, G, L, M, Number of primary branches of IBA-1-positive cells in control and immune-stimulated aged mice, 24 h (F) and three months (G) after immune stimulation and adult mice 24 h (L) and three months (M). H, I, N, O, Quantification of GFAP-positive cells in aged mice, 24 h (H) and three months (I) after immune stimulation, normalized to aged controls and 24 h (N) and three months (O) in adult mice, normalized to the respective adult controls; N = 3 mice per group (n = 8–10), N = 4 or 5 mice in E, G, I (n = 12–15); n = number of samples; all data are presented as mean ± SEM; *p < 0.05, **p < 0.01, ***p < 0.001.
