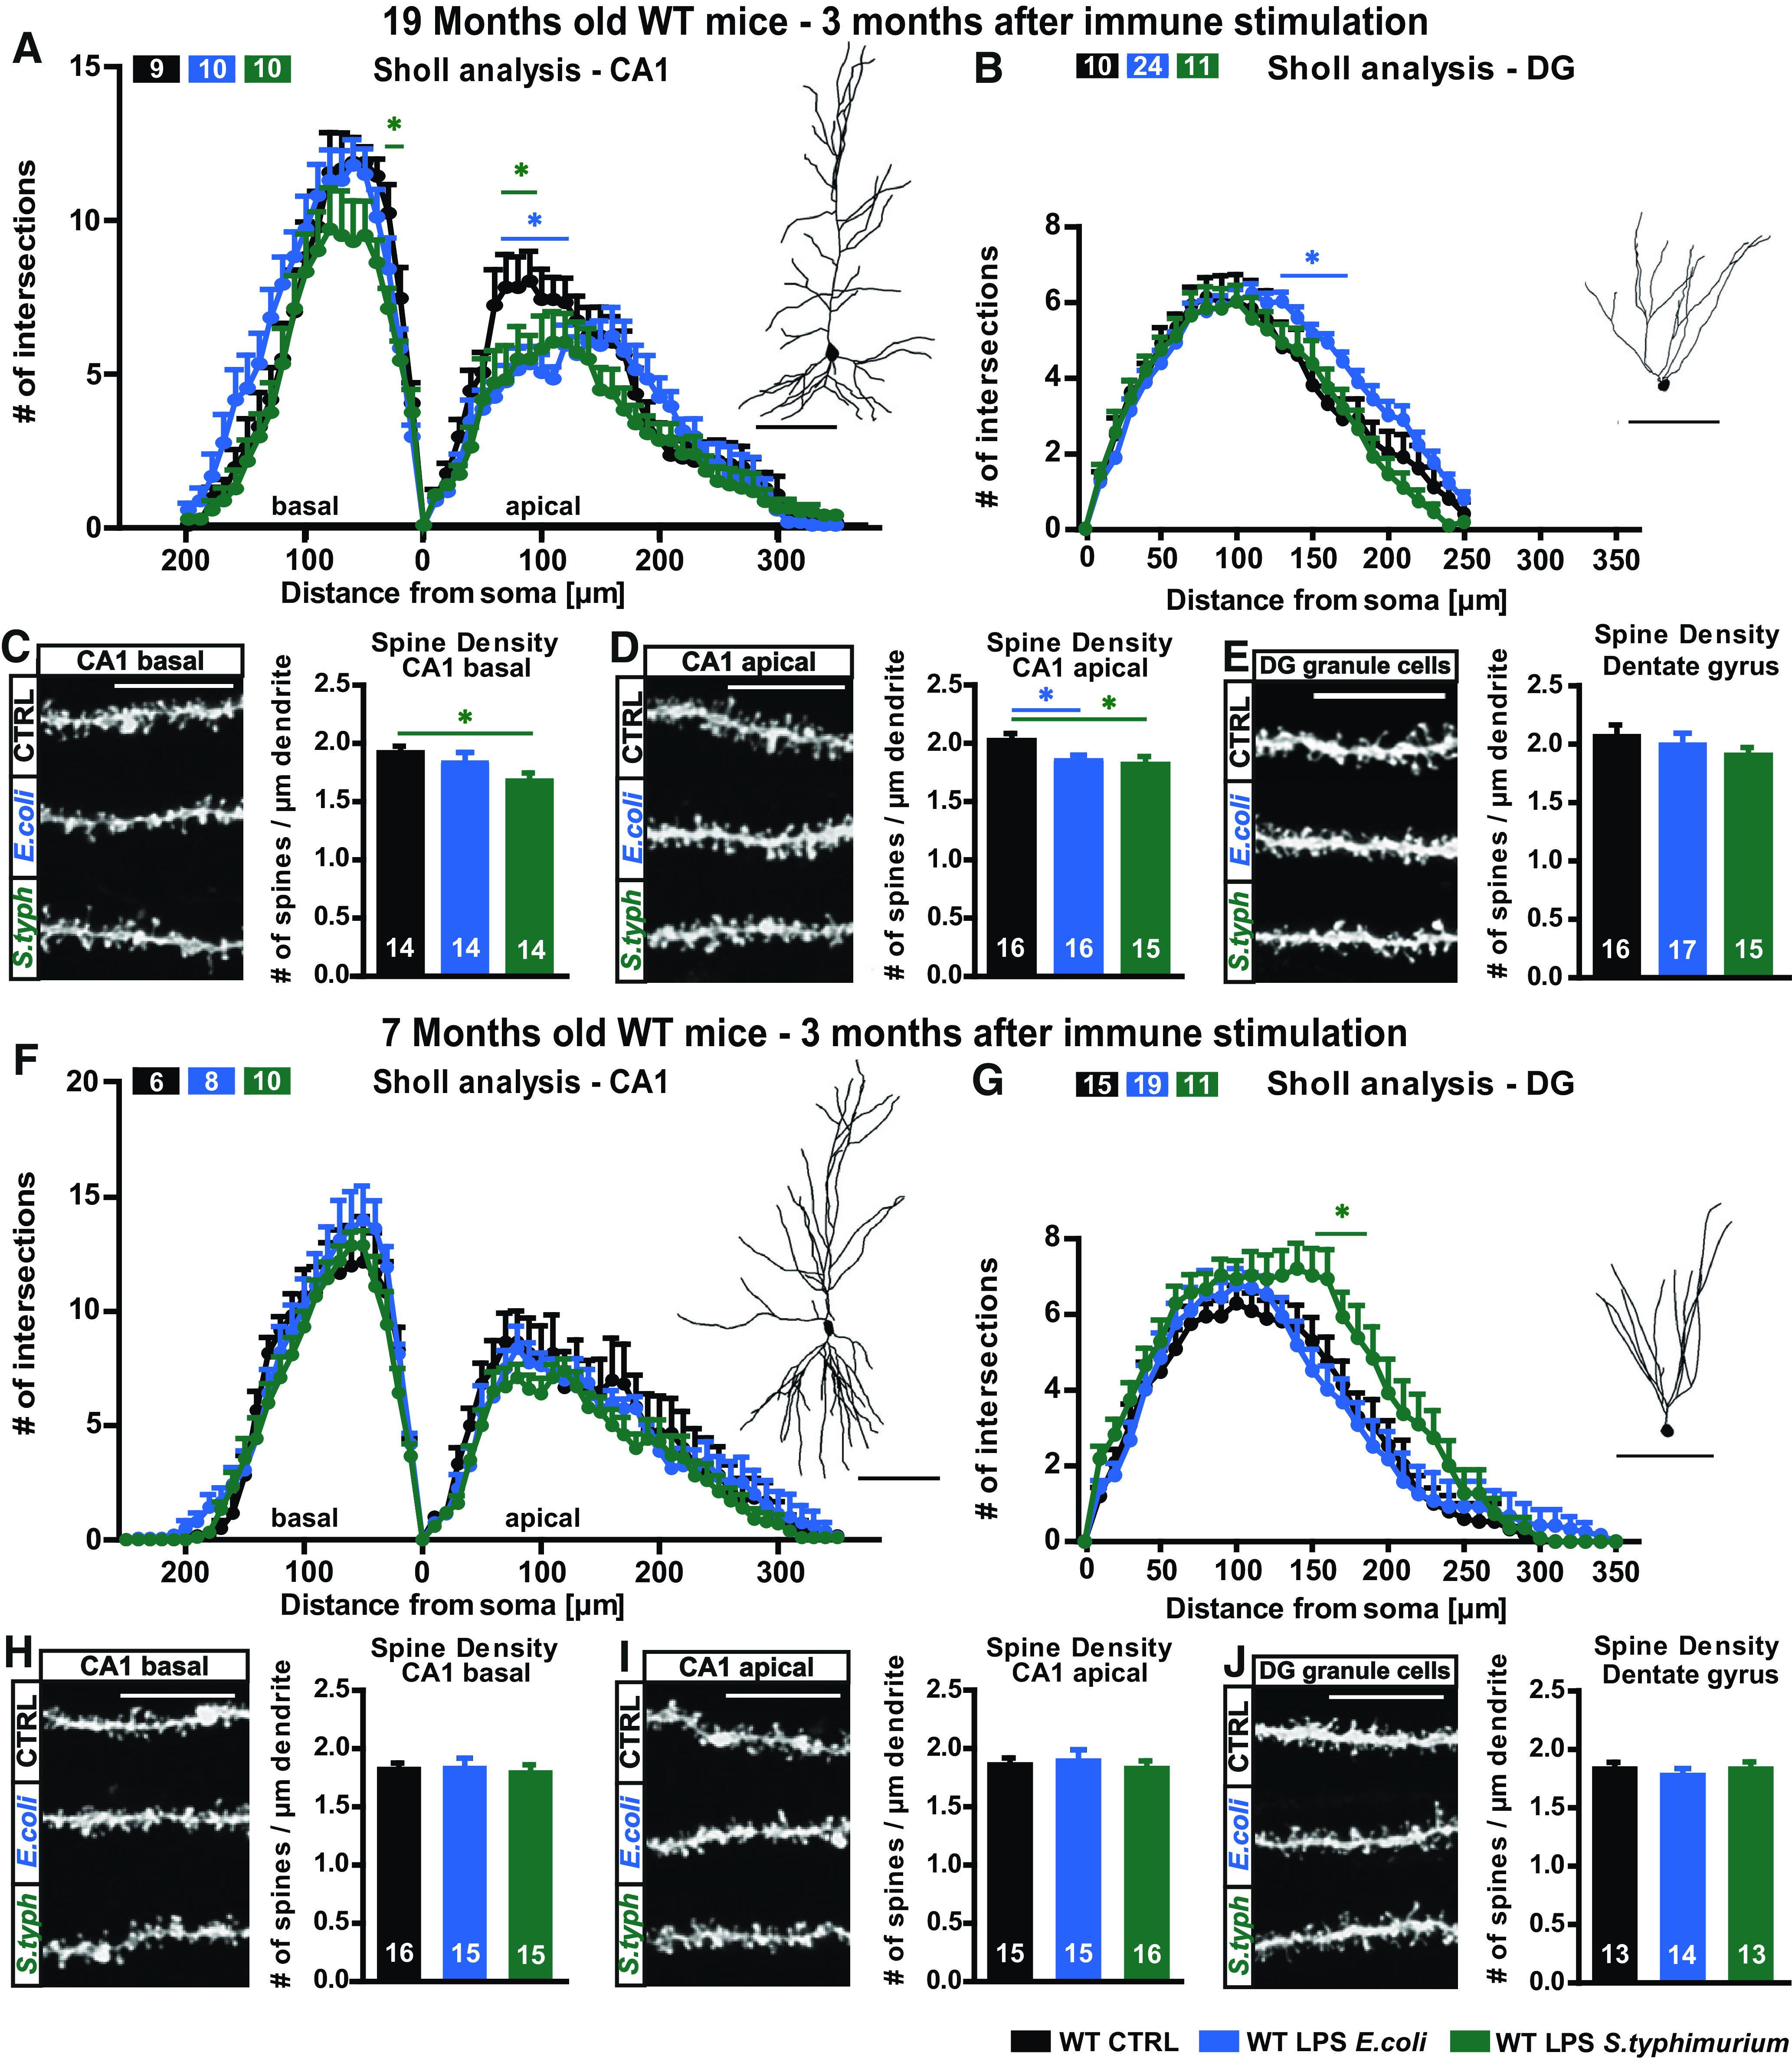
Figure 3.

Neuronal morphology of adult and aged WT mice three months after immune stimulation with 0.4 µg/g body weight LPS of E. coli or S. typhimurium. A–E, Neuronal architecture of 16- to 19-month-old WT mice, control (black), LPS E. coli (blue), and LPS S. typhimurium (green): tracings and Sholl analysis of (A) CA1 pyramidal neurons and (B) DG granule cells. Confocal microscopic images and spine density analysis from (D) apical CA1 dendrites, (C) basal CA1 dendrites, and (E) granule cells from the DG. F–J, Neuronal architecture of seven-month-old WT mice, control (black), LPS E. coli (blue), and LPS S. typhimurium (green): dendritic complexity and respective tracing of (F) CA1 hippocampal neurons and (G) DG granule cells. Spine density and confocal images of typical dendrites from (I) apical CA1 dendrites, (H) basal CA1 dendrites, and (J) DG granule cells; N = 3 (A, n = 9–10; B, n = 10–24; C, n = 14; D, n = 15–16; E, n = 15–17; F, n = 6–14; G, n = 11–19; H–J, n = 13–16); n = number of samples, scale bar of tracings, 100 µm; scale bar of confocal fluorescent images, 10 µm; all data are presented as mean ± SEM, *p < 0.05.
