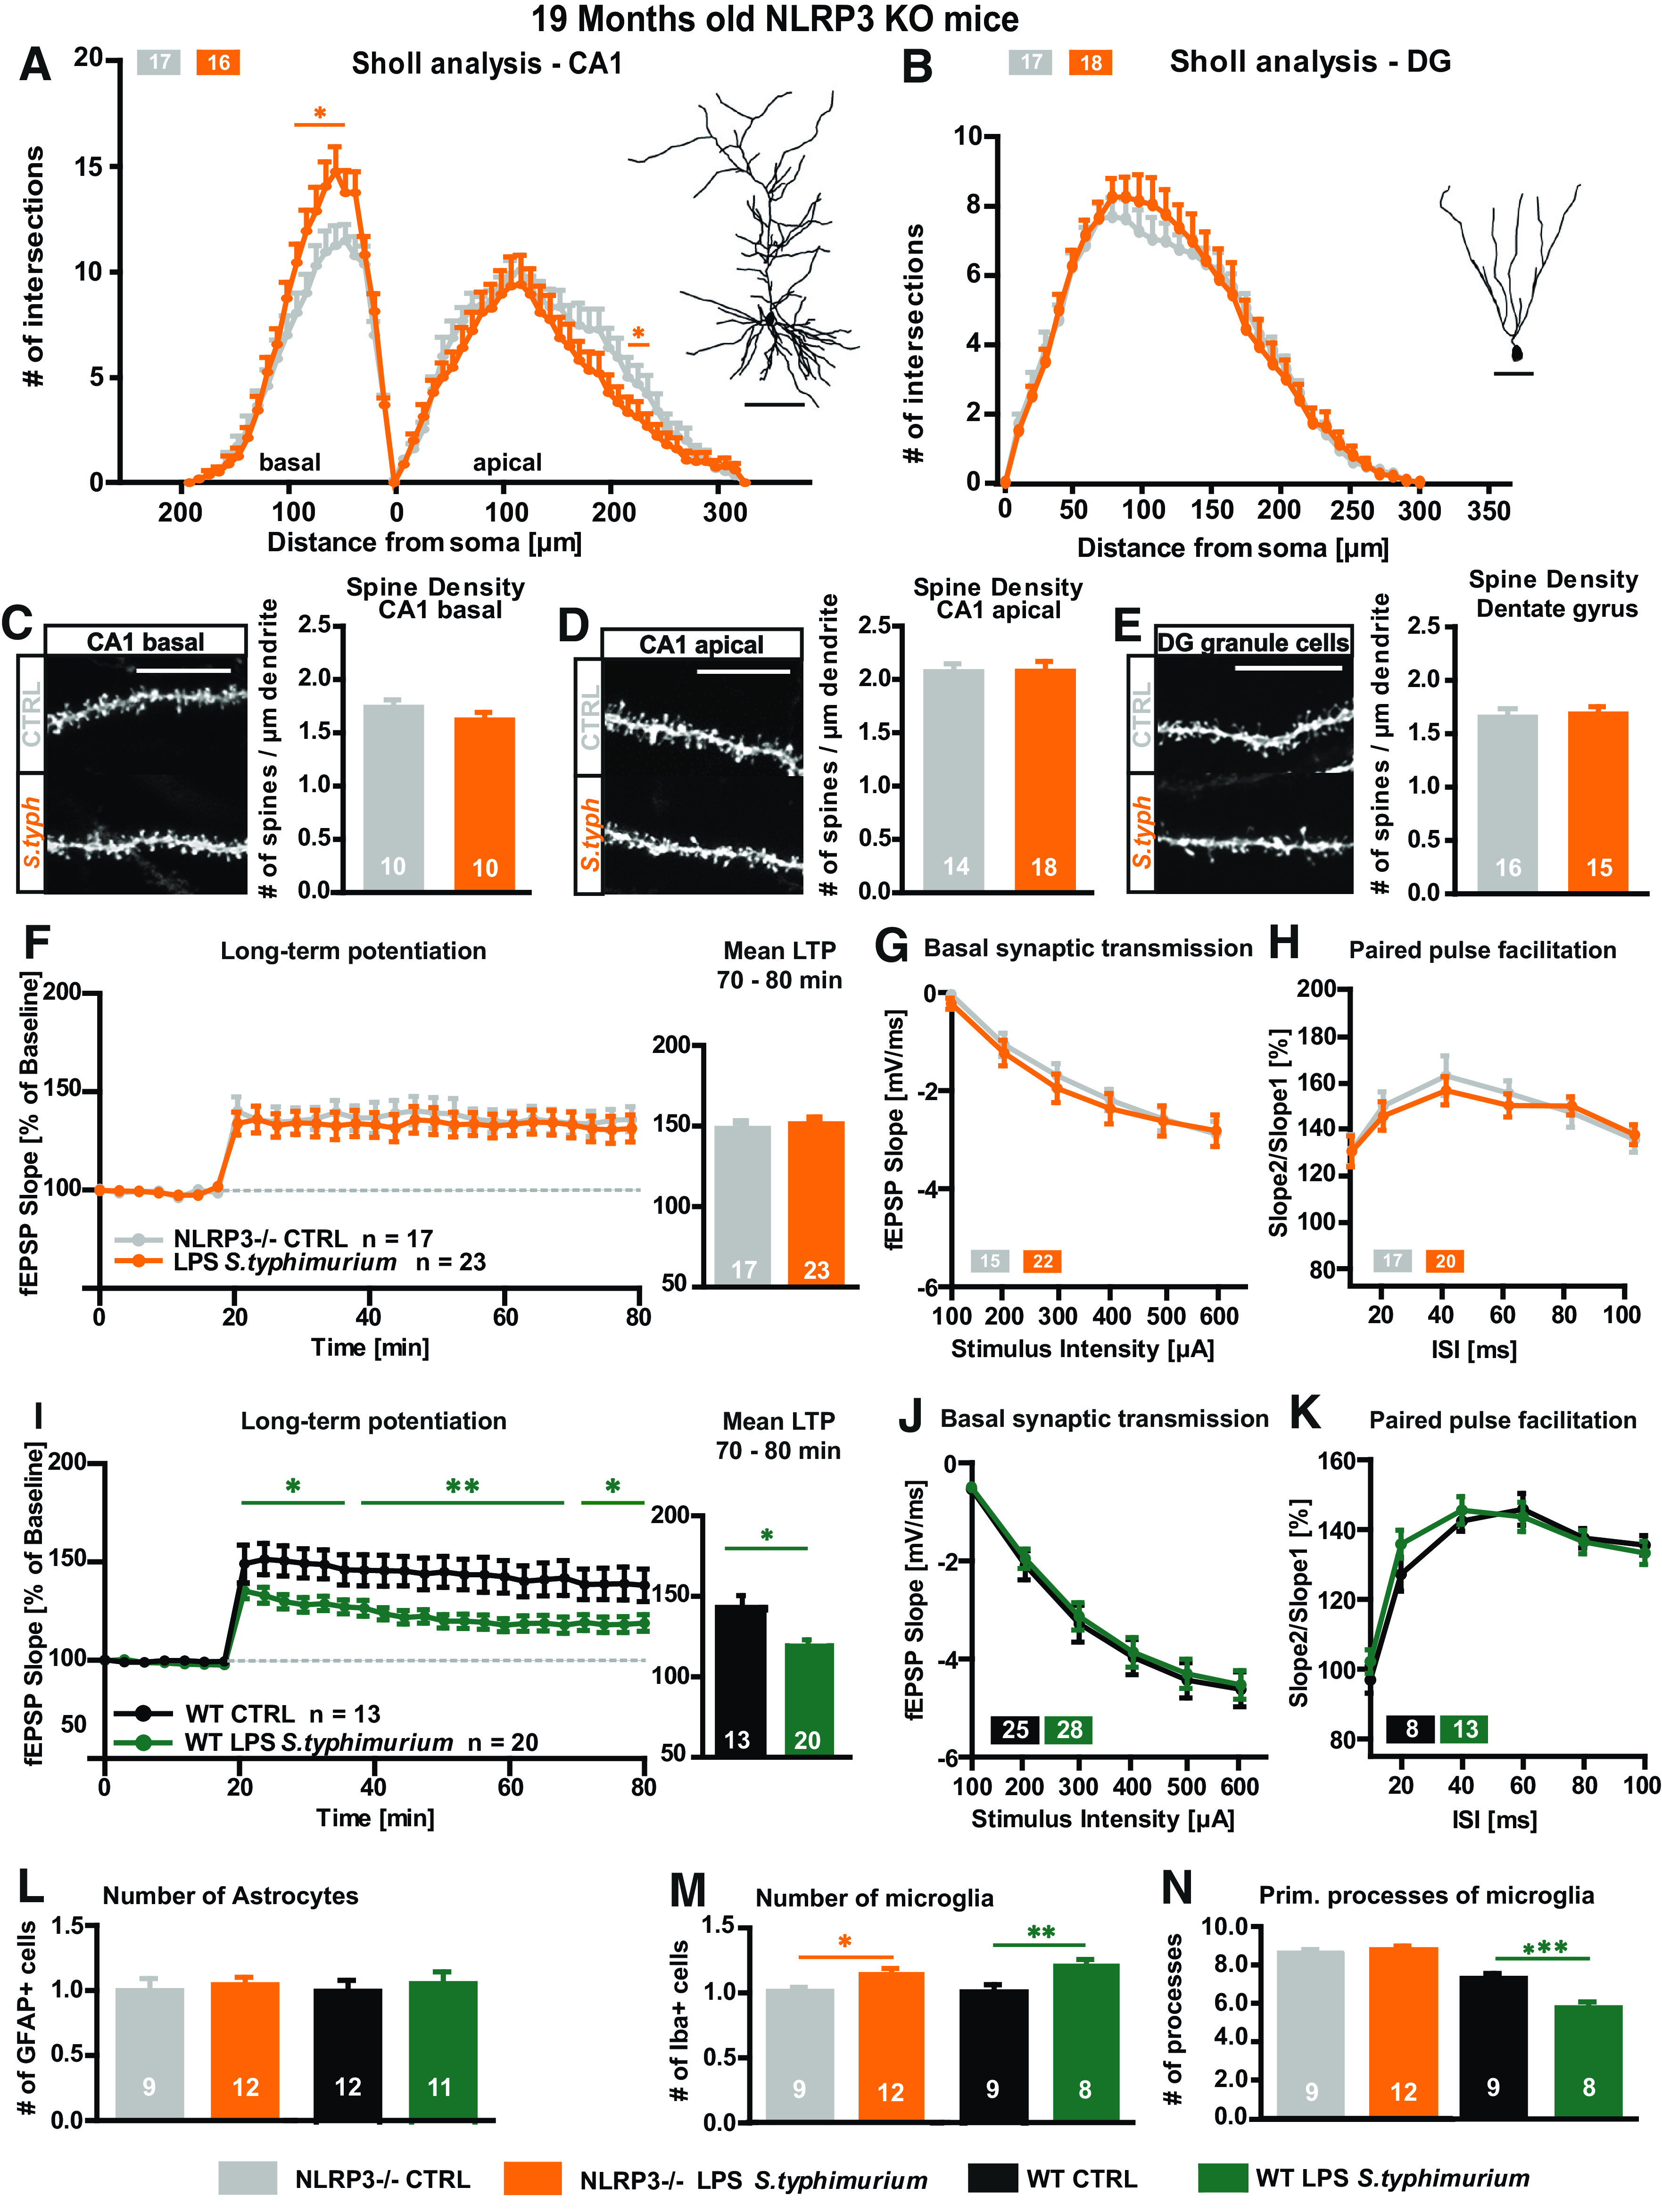
Figure 6.

Neuronal morphology and synaptic plasticity of aged NLRP3 KO mice after immune stimulation with S. typhimurium LPS. A–E, Neuronal architecture of 19-month-old NLRP3 KO mice; CTRL (gray), LPS S. typhimurium (orange): tracings and Sholl analysis of (A) CA1 pyramidal neurons and (B) DG granule cells. Spine density and exemplified confocal microscopic images from (D) mid-apical CA1 dendrites, (C) CA1 basal dendrites, and (E) of granule cells from the DG. F–H, Short-term and long-term synaptic plasticity at the CA3-CA1 pathway in hippocampal acute slices of aged NLRP3 KO mice three months after peripheral immune stimulation: (F) LTP induced via TBS shown as fEPSP slope % of baseline and mean LTP as fEPSP slope % of baseline for minutes 70–80 of recording. G, Input-output curve. H, PPF with increasing ISIs. I–K, Short-term and long-term synaptic plasticity at the CA3-CA1 pathway in hippocampal acute slices of aged WT mice three months after peripheral immune stimulation: (I) LTP induced via TBS shown as fEPSP slope % of baseline and mean LTP as fEPSP slope % of baseline for minutes 70–80 of recording. J, Input-output curve. K, PPF with increasing ISIs. L–N, Astrocyte and microglia phenotype in the stratum radiatum of the CA1 area of aged NLRP3 KO mice three months after peripheral immune stimulation: (L) quantification of GFAP-positive cells in aged NLRP3 KO mice (CTLR gray, LPS S. typhimurium orange) and WT mice (CTRL black, LPS S. typhimurium green). M, Relative number of IBA-1-positive cells of immune-stimulated mice compared with the respective aged controls, NLRP3 KO mice (gray, orange), WT mice (black, green) and the change between both immune-stimulated groups in %. N, Number of primary branches of IBA-1-positive cells in control (gray) and immune-stimulated aged NLRP3 KO mice (orange) and immune-stimulated WT mice with (black, green) and comparison between the immune-stimulated groups as fold change, respectively; N = 3–4 mice per group, n = 9–23 number of samples; scale bar of tracings, 100 µm; scale bar of confocal fluorescent images, 10 µm; all data are presented as mean ± SEM; *p < 0.05, **p < 0.01; ***p < 0.001.
