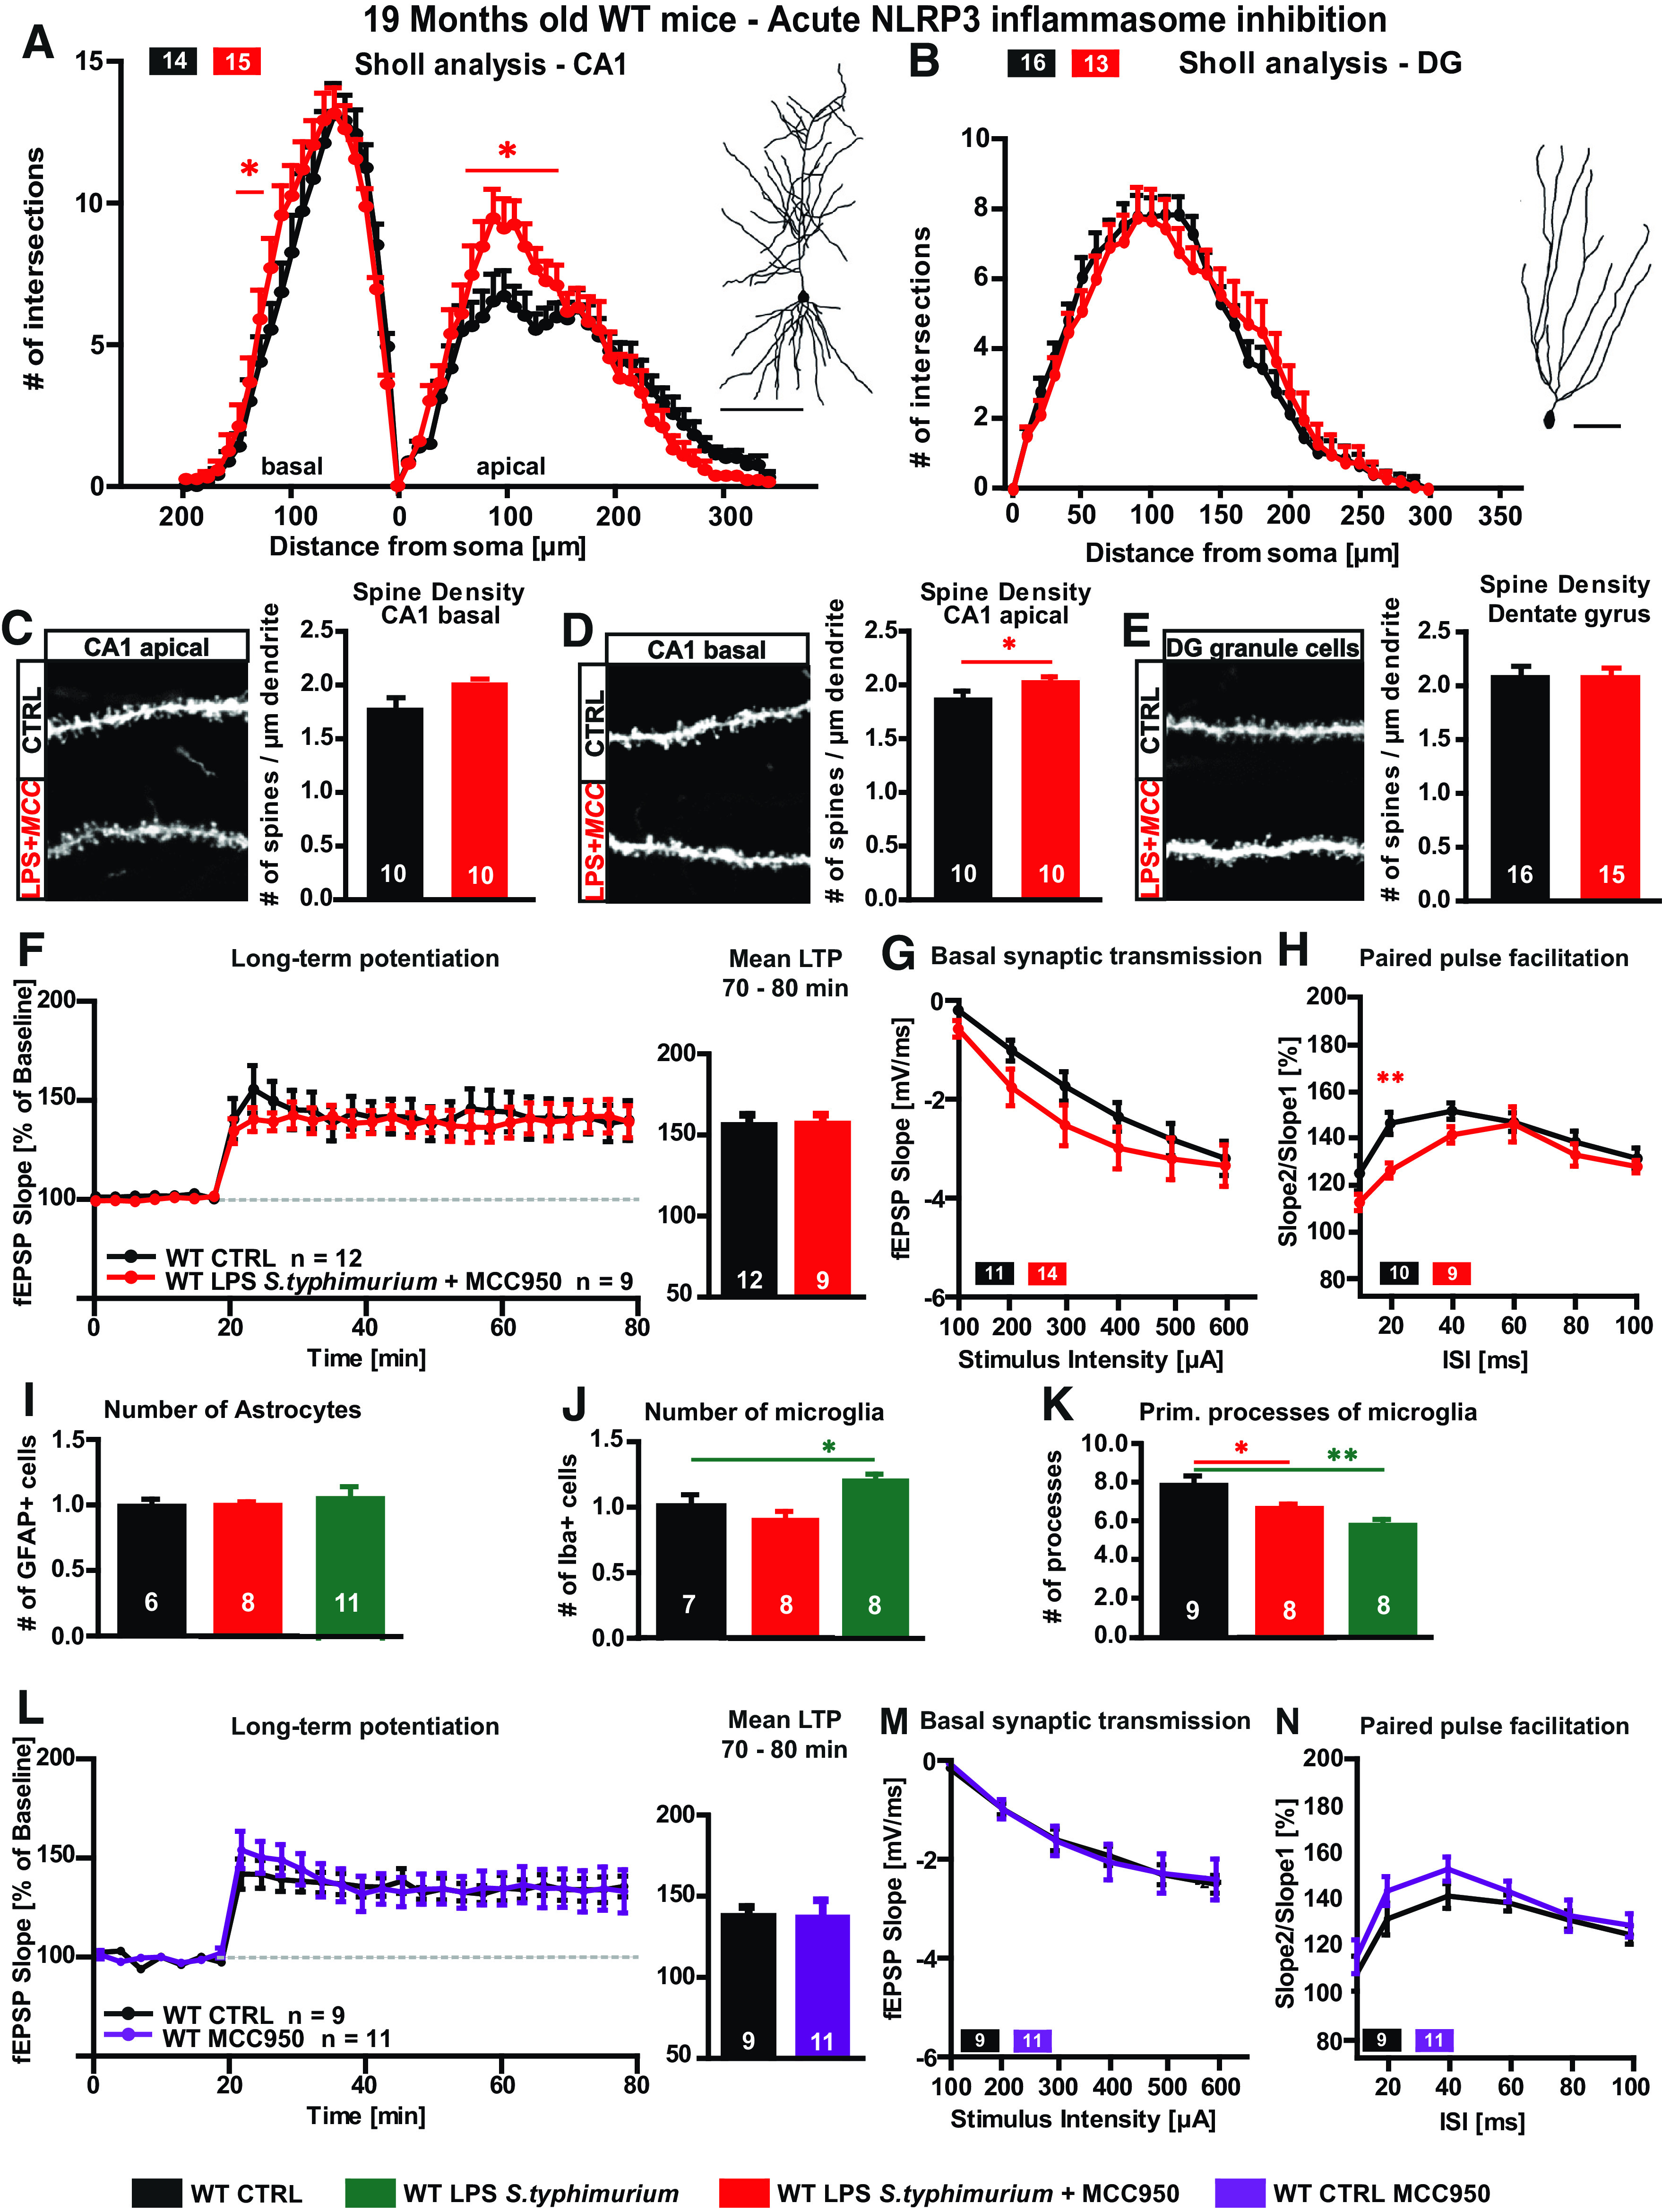
Figure 7.

Neuronal morphology and synaptic plasticity of aged LPS immune-stimulated WT mice after MCC950 treatment A–E, Neuronal architecture of 19-month-old WT mice, CTRL (black) versus LPS S. typhimurium treated with MCC950 (20 µg/g bodyweight, red): dendritic complexity and exemplified tracing of (A) CA1 hippocampal neurons and (B) DG granule cells. Confocal microscopic image and spine density of (C) basal CA1 dendrites, (D) mid-apical CA1 dendrites, and (E) DG granule cells. F–H, Synaptic plasticity of aged WT mice, CTRL versus LPS S. typhimurium treated with MCC950: (F) LTP as fEPSP slope % of baseline and quantification of 70–80 min of LTP measurement. G, Input-out properties. H, Short-term synaptic plasticity, PPF. I–K, Astrocyte and microglia phenotype in the stratum radiatum of the CA1 area of aged MCC950-treated WT mice three months after peripheral immune stimulation: (I) relative number of GFAP-positive cells: CTRL versus LPS S. typhimurium with MCC950 treatment (red) and CTRL (black) versus LPS S. typhimurium (green). J, Quantification of IBA-1-positive cells in WT mice, CTRL (black) versus LPS S. typhimurium with (red), or without MCC950 treatment (green), differences between both immune-stimulated groups as fold change in %. K, Number of primary branches of IBA-1-positive cells in controls (black) and immune-stimulated WT mice with (red) or without MCC950 (green) and comparison between the immune-stimulated groups as fold change, respectively. L–N, Synaptic plasticity of aged WT mice, CTRL versus CTRL treated with MCC950: (L) LTP as fEPSP slope % of baseline and quantification of 70–80 min of LTP measurement. M, Input-out properties. N, Short-term synaptic plasticity, PPF; N = 3 mice per group, n = 7–15 number of samples; scale bar of tracings, 100 µm; scale bar of confocal fluorescent images, 10 µm; all data are presented as mean ± SEM; *p < 0.05, **p < 0.01.
