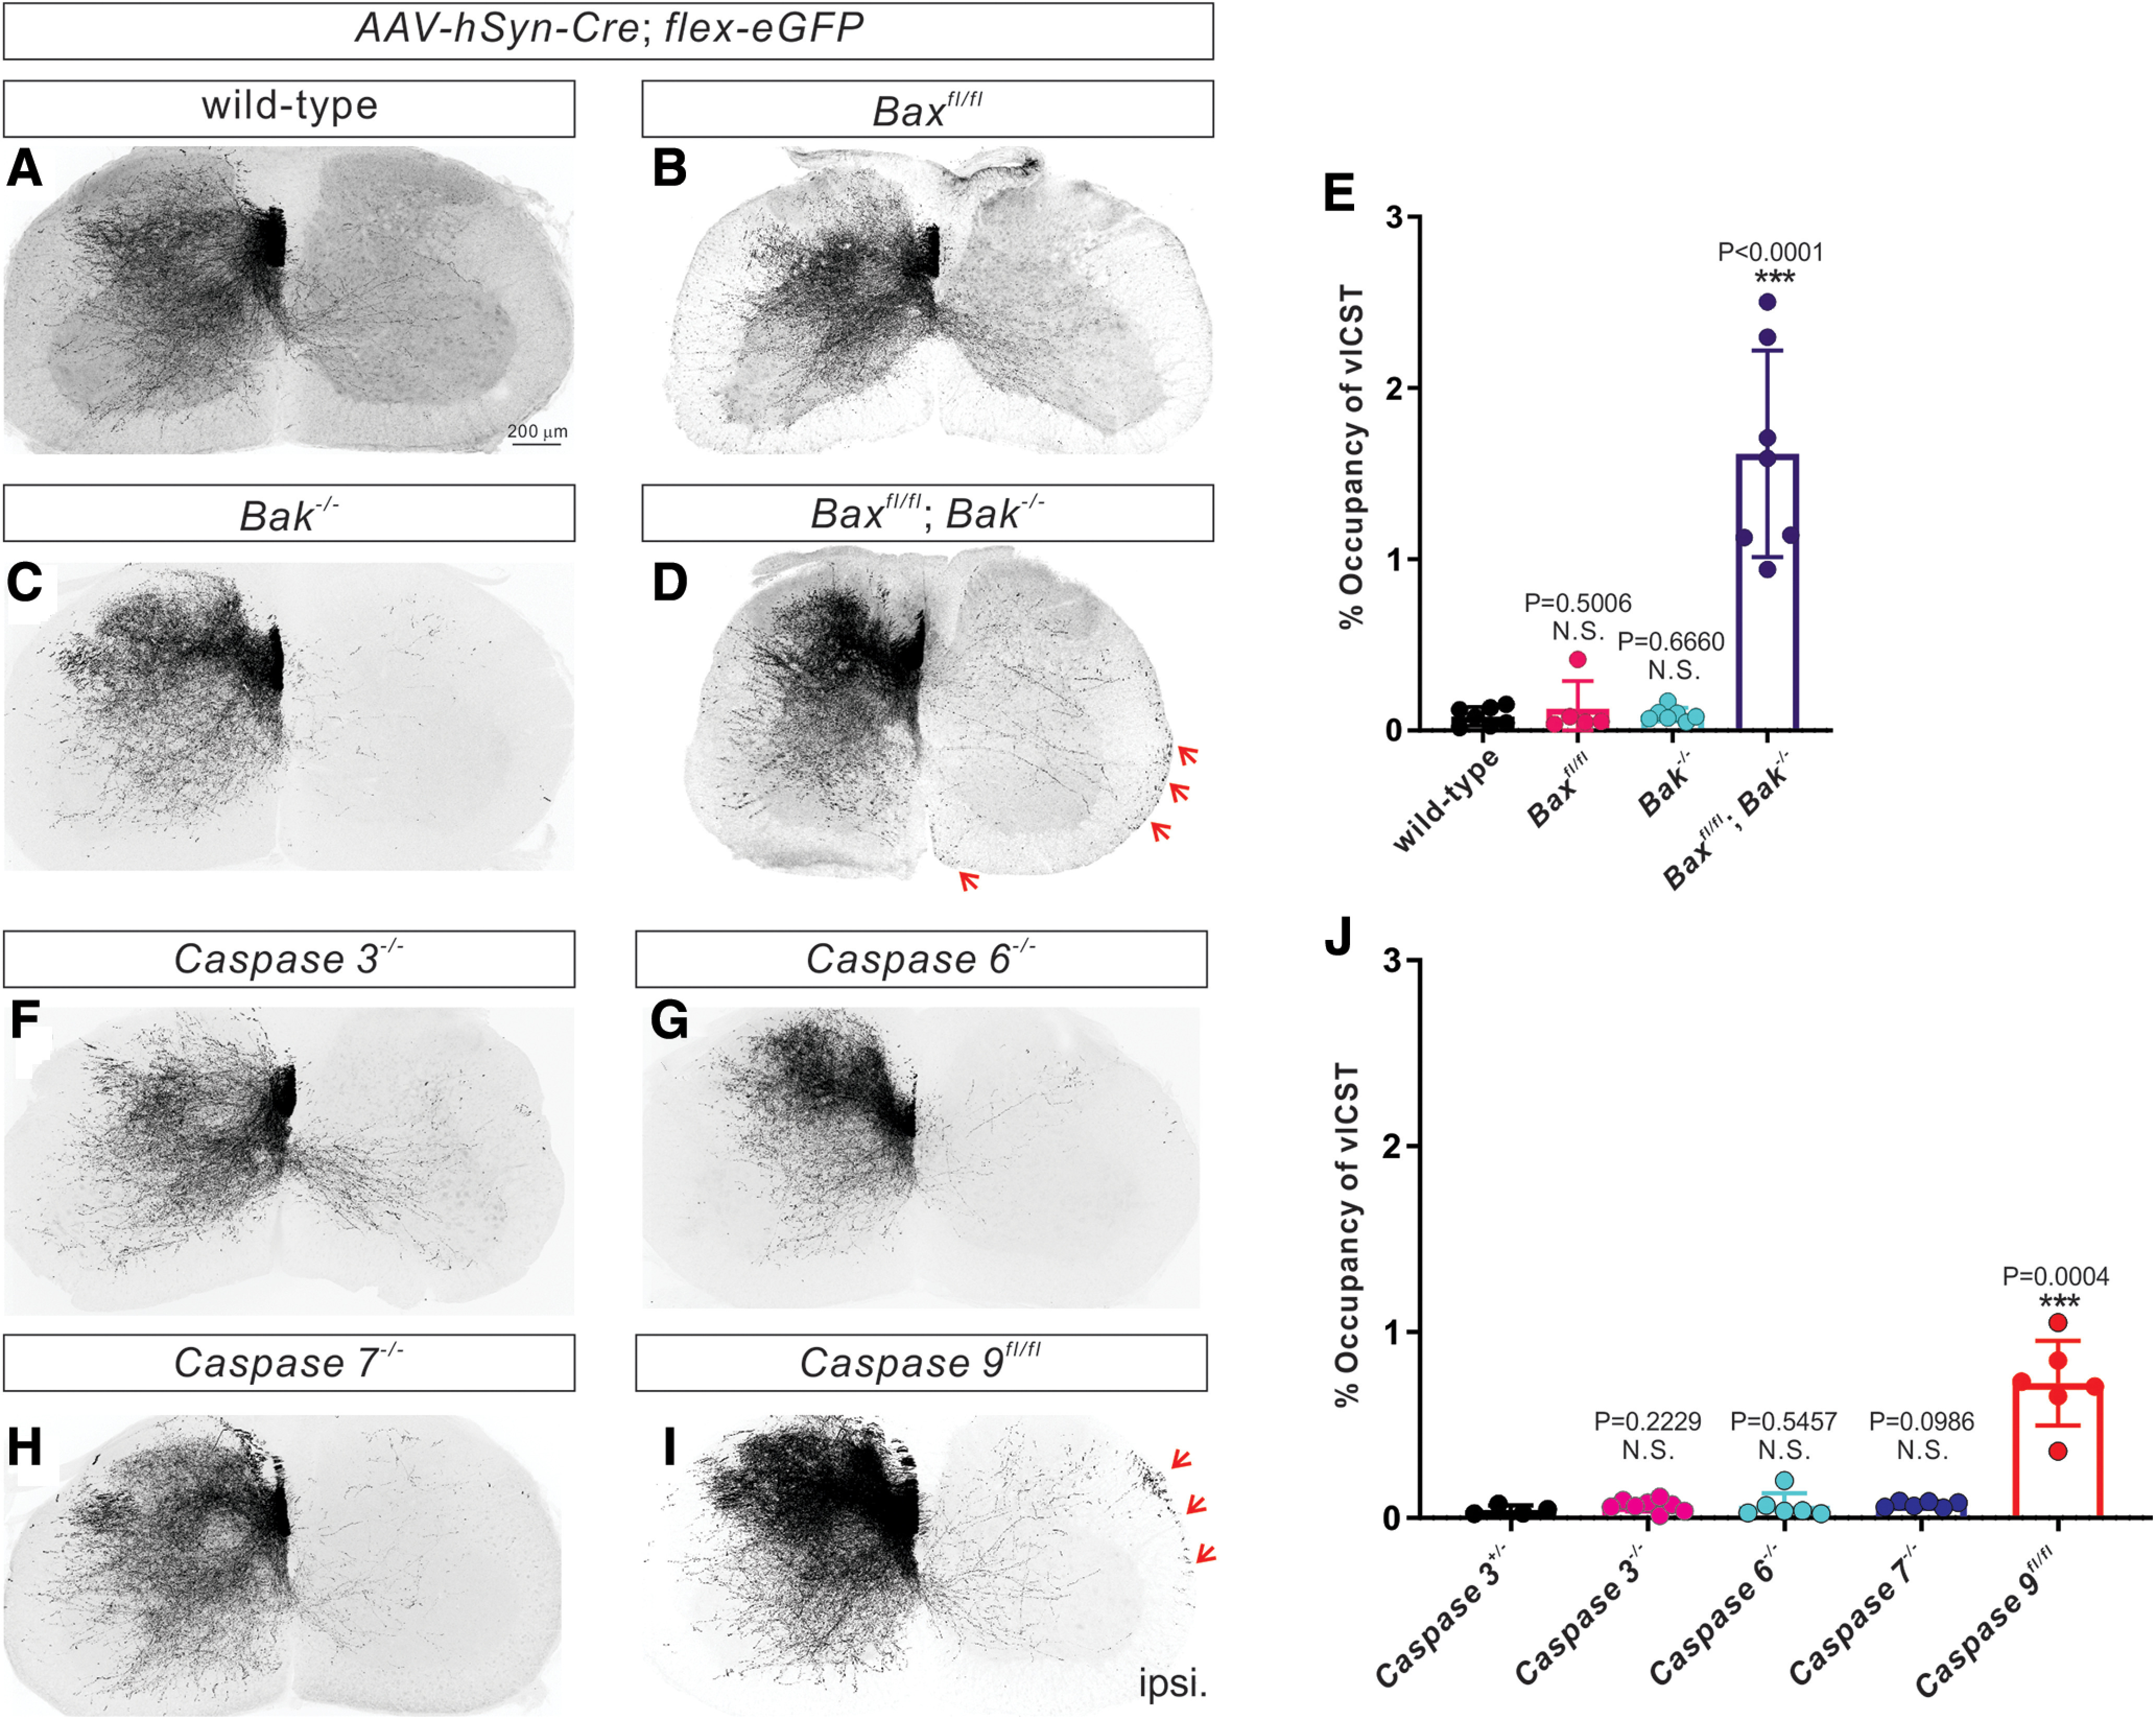
Figure 3.

Bax/Bak and caspase-9 loss of function causes vlCST pruning defects. A-D, Representative images of cervical spinal cords showing the absence of vlCST in P21 WT (A, n = 7 mice), Baxfl/fl (B; n = 5 mice), and Bak–/– (C; n = 4 mice) mice and the presence of vlCST (indicated by red arrows) in Baxfl/fl Bak−/− mice (D; n = 9 mice). E, Quantification of the average area occupied by vlCST in the ipsilateral ventral and lateral funiculi, demonstrating that Baxfl/fl Bak−/− mice (1.615 ± 0.2278%; p < 0.0001, unpaired t test) but not Baxfl/fl (0.1271 ± 0.07238%, p = 0.5006, unpaired t test) or Bak–/– (0.09308 ± 0.01490%, p = 0.6660, unpaired t test) mice, shows a significantly greater presence of vlCST compared with control mice (0.08184 ± 0.02059%). F-I, Representative images of cervical spinal cords showing the absence of vlCST in P21 caspase-3–/– (F; n = 8 mice), caspase-6–/– (G; n = 6 mice), and caspase-7–/– (H; n = 6 mice) mice and the presence of vlCST (indicated by red arrows) in caspase-9fl/fl mice (I; n = 6 mice). J, Quantification showing that the average area occupied by vlCST in the ipsilateral ventral and lateral funiculi of caspase-9fl/fl mice (0.7251 ± 0.09310%, p = 0.0004, unpaired t test), but not caspase-3–/– (0.06655 ± 0.01128%, p = 0.2229, unpaired t test), caspase-6–/– (0.06549 ± 0.02768%, unpaired t test), or caspase-7–/– (0.06612 ± 0.006429%, unpaired t test) mice, is significantly higher than caspase-3+/– mice (0.04285 ± 0.01203%). Scale bar: A, 200 μm.
