Figure 1.

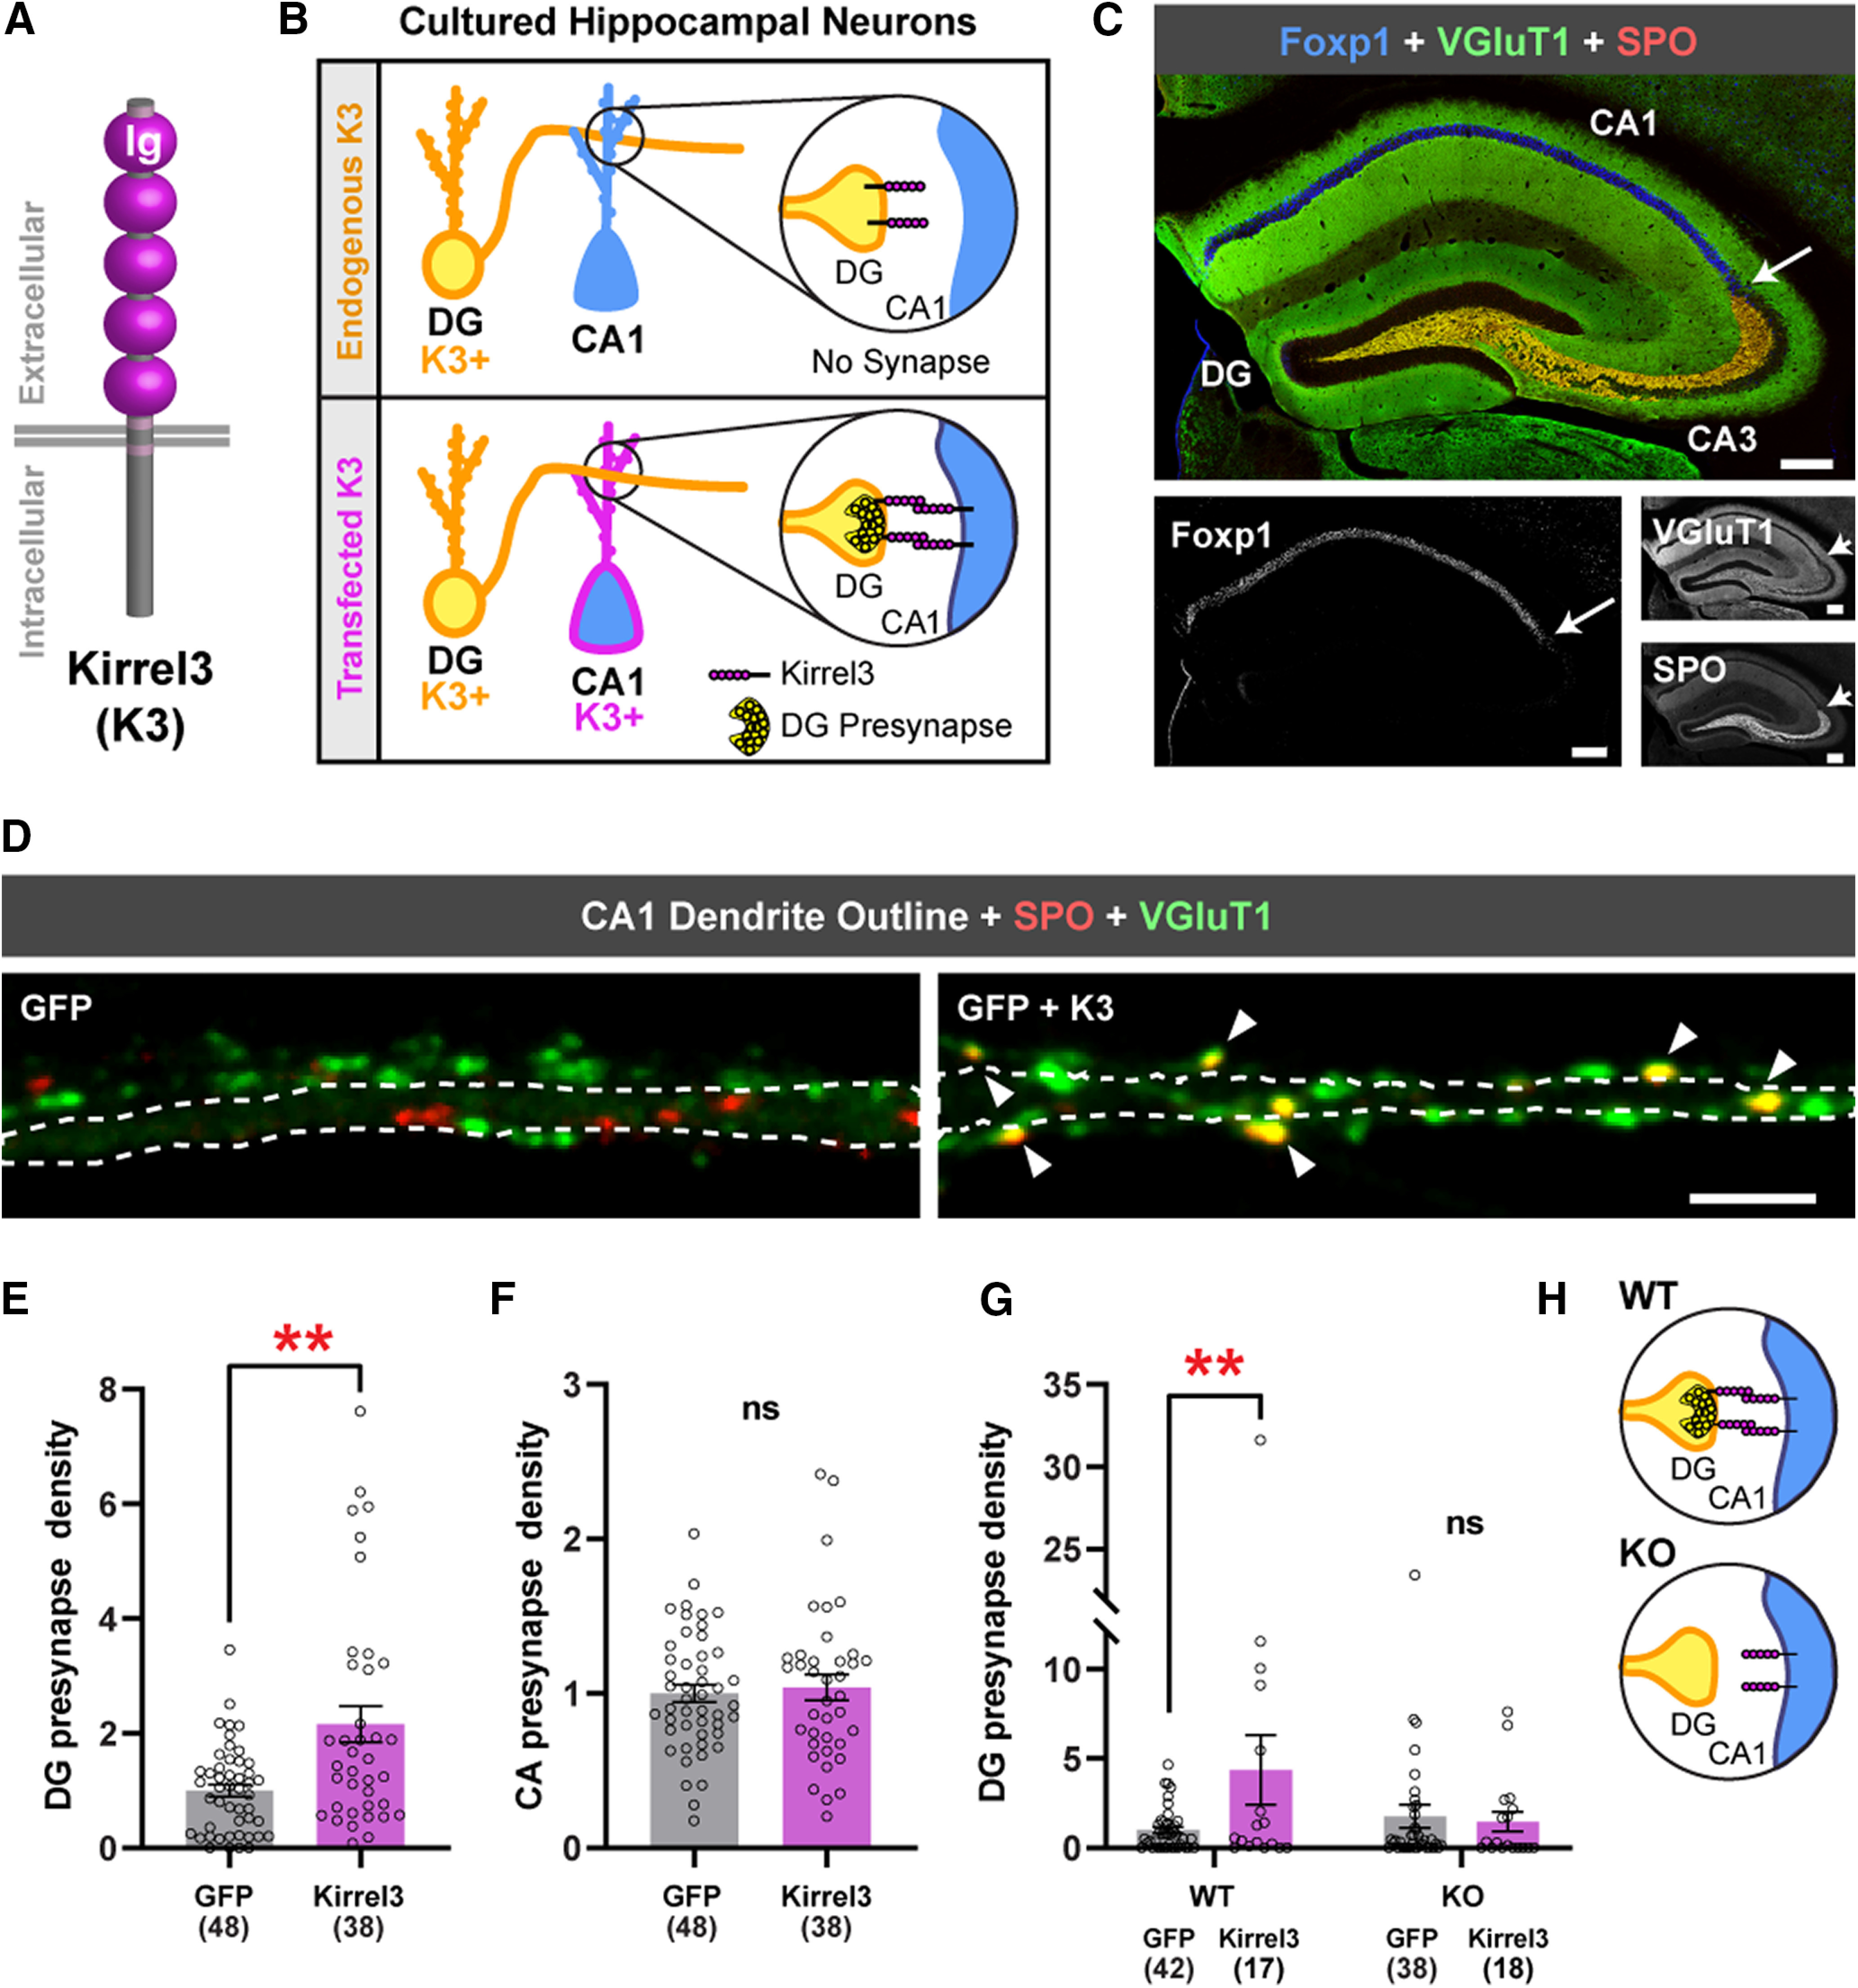
Ectopic Kirrel3 expression induces ectopic DG presynapses in cultured neurons. A, Schematic of Kirrel3 (K3) protein. Ig, Immunoglobulin domain. B, Schematic of the gain-of-function assay design. Top, In the control condition, a Kirrel3-positive DG neuron contacts a Kirrel3-negative CA1 dendrite and does not form a presynapse. Bottom, A Kirrel3-positive DG neuron contacts a Kirrel3-transfected CA1 neuron allowing a DG presynapse to form. C, Tiled 20× image of an adult mouse hippocampal section immunostained with the CA1 marker Foxp1 (blue) and the presynaptic markers VGluT1 (green) and SPO (red). Grayscale images below. In each image, the white arrow indicates approximate CA3 border. Scale bars, 200 μm. D, Dendrites from cultured rat CA1 dendrites transfected with GFP (left) or GFP + Kirrel3 (right). GFP is not shown but is outlined in white. DG presynapses (yellow) are identified by colabeling of SPO (red) and VGluT1 (green). Arrowheads point to DG presynapses. Scale bar, 5 μm. E, Quantification of DG presynapse density per length of CA1 dendrite and normalized to the GFP condition. n = 38-48 neurons (indicated under each bar) from three cultures. p = 0.0027 (Mann–Whitney test). F, Quantification of CA synapse density per length of CA1 dendrite and normalized to the GFP condition. n = 38-48 neurons (indicated under each bar) from three cultures. p = 0.9552 (Mann–Whitney test). G, Quantification of DG presynapse density per length of CA1 dendrite from Kirrel3 WT and KO cultures. All are normalized to the WT GFP condition. n = 17-42 neurons (indicated under each bar) from three cultures. WT: GFP versus GFP+Kirrel3, p = 0.0088; KO: GFP versus GFP+Kirrel3, p = 0.9560 (two-way ANOVA with Sidak's multiple comparisons, p = 0.0266; interaction). **p < 0.01. H, Schematic of WT versus KO assay results, suggesting that Kirrel3 must be present in both the presynaptic and postsynaptic neuron to induce DG synapse formation. E, F, G, Bar graphs show the mean ± SEM. Individual data points represented by open circles.
