Figure 3.
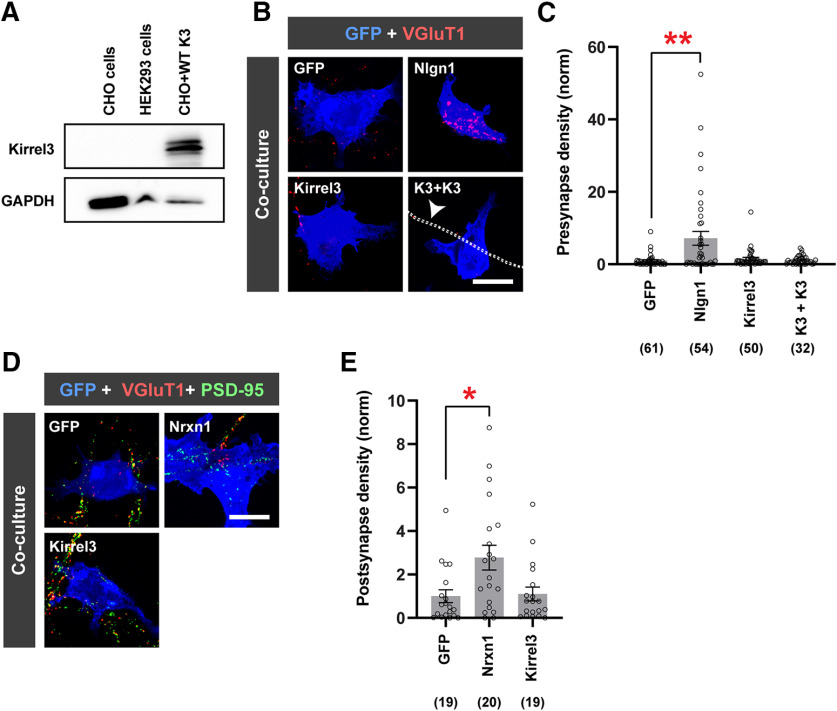
Kirrel3 in a non-neuronal cell is not sufficient to mediate synapse formation. A, Immunoblot of untransfected CHO and HEK293 cell lysates showing no detectable endogenous Kirrel3 expression. CHO cells transfected with FLAG-Kirrel3-pBOS were used as a positive control. B, Representative images of the presynaptic neuron/HEK293 coculture assay. Cultures were immunostained for GFP (blue) to label transfected HEK293 cells and VGluT1 (red) to label presynapses. Transfection conditions are indicated on each image. Nlgn1, Neuroligin-1; K3, Kirrel3. Bottom right, Arrow points to an outline of a FLAG-Kirrel3-positive axon. C, Quantification of presynaptic hemisynapse density from the coculture assay normalized to the GFP-only negative control (GFP). n = 32-61 cells (indicated under each bar) from 2 cultures. GFP versus Nlgn1, p = 0.0074; GFP versus Kirrel3, p = 0.3988; GFP versus K3+K3, p > 0.9999 (one-way ANOVA Kruskal–Wallis test, p = 0.0226, with Dunn's multiple comparisons). D, Images of the postsynaptic hemisynapse density from the coculture assay. Cultures were immunostained with GFP (blue), vGluT1 (red), and PSD-95 (green). Postsynaptic hemisynapses are labeled by PSD-95 alone with no VGluT1. Nrxn1, Neurexin-1. E, Quantification of postsynaptic hemisynapse density from coculture assay normalized to the GFP-only negative control. n = 19 or 20 cells (indicated under each bar) from one culture. GFP versus Nrxn1, p = 0.0252; GFP versus Kirrel3, p > 0.9999 (one-way ANOVA Kruskal–Wallis test, p = 0.0256, with Dunn's multiple comparisons). Scale bars: A, C, 20 μm. *p < 0.05. **p < 0.01. C, E, Bar graphs show the mean ± SEM with individual data points represented by open circles.

