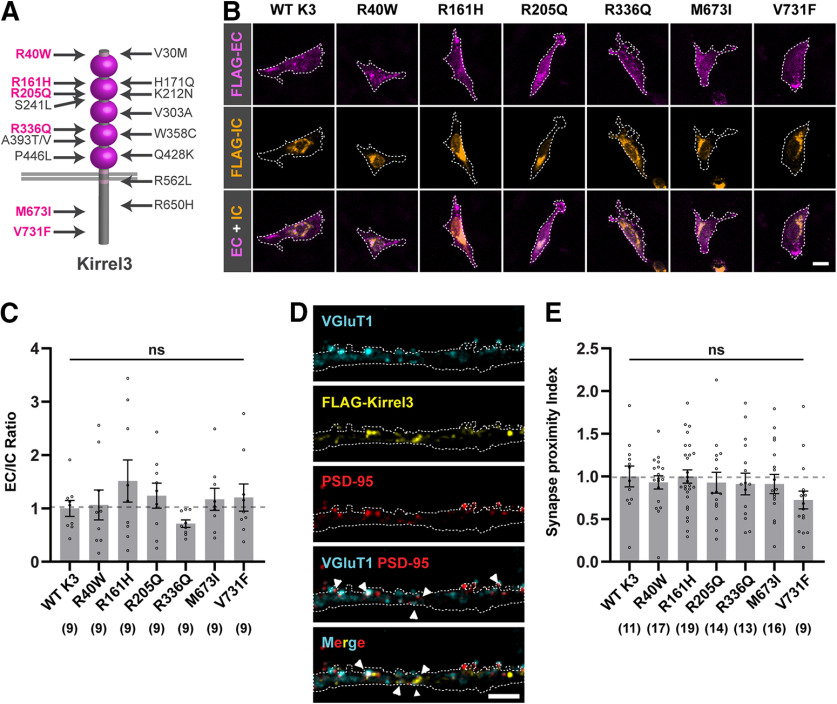
Figure 4.
Kirrel3 missense variants show normal surface localization. A, Schematic of Kirrel3 protein with approximate positions of disease-associated missense variants. Magenta represents variants tested in this study. B, Representative images of CHO cells transfected with mCh-2A-FLAG-Kirrel3 variants. Cells were live-labeled with chicken-anti-FLAG (magenta) to show extracellular (EC) Kirrel3 protein and then permeabilized and stained with mouse-anti-FLAG (orange) to show intracellular (IC) Kirrel3 protein. Cell area was determined by GFP expression and is depicted by a white outline. Scale bar, 15 μm. C, Quantification of EC/IC Kirrel3 protein levels normalized to WT Kirrel3. n = 9 cells each from three cultures; p = 0.4424 (one-way ANOVA). D, Representative images showing a dendrite from an mCherry-2A-FLAG-Kirrel3 WT-transfected neuron. EC FLAG-Kirrel3 (yellow) localizes adjacent to juxtaposed synaptic markers VGluT1 (blue) and PSD-95 (red). mCherry-2A (white outline) served as a cell marker for dendrite area. Scale bar, 4 μm. E, Quantification of Kirrel3 synaptic localization. Shown is the synapse proximity index (a measure of juxtaposed VGluT1+, PSD-95+ puncta with adjacent FLAG-Kirrel3 puncta) for each variant normalized to WT Kirrel3. n = 9-19 neurons (indicated under each bar) from two cultures, p = 0.3197 (one-way ANOVA Kruskal–Wallis test). C, E, Bar graphs show the mean ± SEM with individual data points represented by open circles. ns = not significant.

