Figure 5.
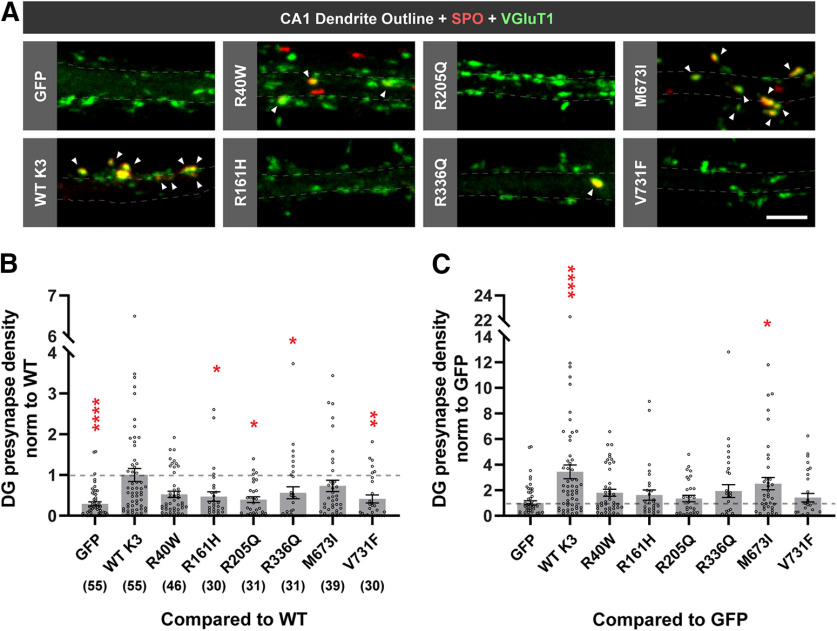
Disease-associated Kirrel3 variants attenuate Kirrel3 synaptogenic function. A, Representative images of CA1 dendrites transfected with GFP only (GFP), or GFP and indicated FLAG-Kirrel3 variants. Outlines indicate dendrite area as determined from GFP expression. DG presynapses (yellow) are identified by colabeling of SPO (red) and VGluT1 (green). Arrows point to DG presynapses. Scale bar, 5 μm. B, Quantification of DG presynapse density on CA1 dendrites normalized to WT Kirrel3 and with multiple comparisons with WT Kirrel3. n = 30-55 neurons (indicated under each bar) from 3-5 cultures (one-way ANOVA Kruskal–Wallis test with multiple comparisons with WT Kirrel3). C, Same data as presented in B, but shown normalized to GFP and with multiple comparisons with GFP. *p < 0.05. **p < 0.01. ****p < 0.0001. For specific p values, see Results. B, C, Bar graphs show the mean ±SEM with individual data points represented by open circles.

