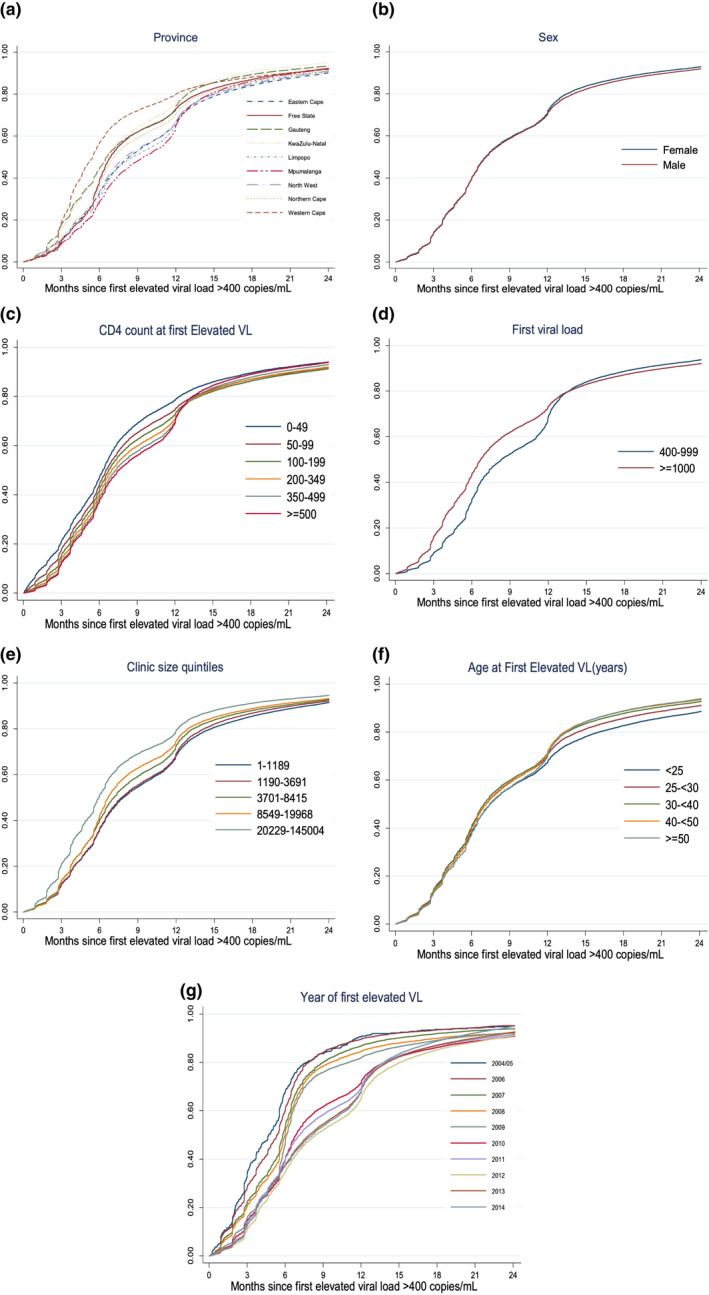
Figure 2.

Kaplan–Meier curves of time to repeat viral load testing among those with an initial elevated viral load (>400 copies/mL) in South Africa’s National HIV Cohort between 2004 and 2014 (n = 371,648) stratified by predictors: (A) Province; (B) Sex; (C) CD4 count; (D) Viral Load (E) Clinic size; (F) Age; (G) Year of eligibility.
