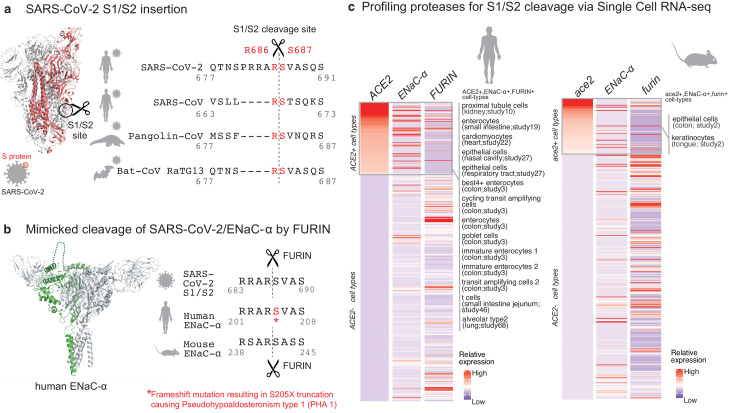
Figure 1. Targeted molecular mimicry by SARS-CoV-2 of human ENaC-ɑ and profiling ACE2-FURIN-ENaC-ɑ co-expression.
(a) The cartoon representation of the S-protein homotrimer from SARS-CoV-2 is shown (PDB ID: 6VSB). One of the monomers is highlighted in red. The alignment of the S1/S2 cleavage site required for the activation of SARS-CoV-2, SARS-CoV, Pangolin-CoV, and Bat-CoV RaTG13 are shown. The four amino acid insertion evolved by SARS-CoV-2, along with the abutting cleavage site is shown in a box. (b) The cartoon representation of human ENaC protein is depicted (PDB ID: 6BQN; chain in green), highlighting the ENaC-ɑ chain in green. The alignment on the right captures FURIN cleavage at the S1/S2 site of SARS-CoV-2, along with its striking molecular mimicry of the identical peptide from human ENaC-ɑ protein (dotted loop in the cartoon rendering of human ENaC). The alignment further shows the equivalent 8-mer peptide of mouse ENaC-ɑ that is also known to be cleaved by FURIN. One of the known genetic alterations on human ENaC-ɑ is highlighted as well (Welzel et al., 2013). (c) The single cell transcriptomic co-expression of ACE2, ENaC-ɑ, and FURIN is summarized. The heatmap depicts the mean relative expression of each gene across the identified cell populations. The human and mouse single cell RNA-seq are visualized independently. The cell types are ranked based on decreasing expression of ACE2. The box highlights the ACE2 positive cell types in human and mouse samples.

