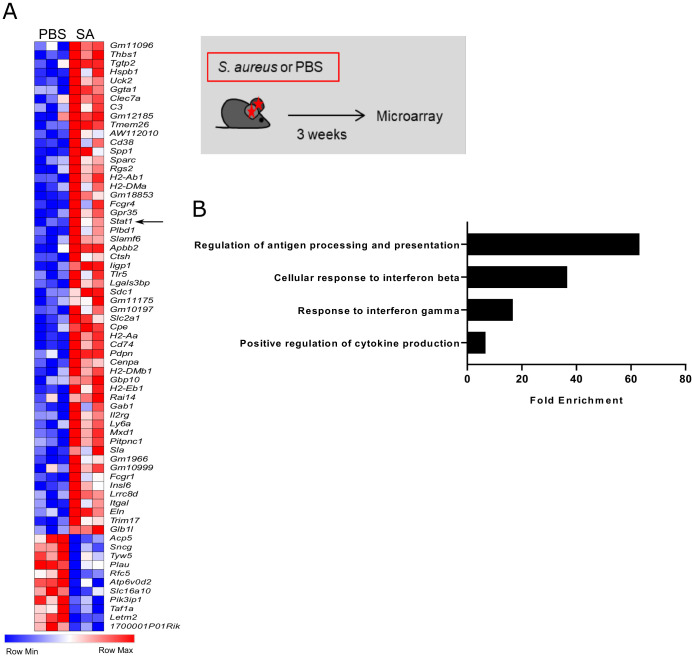
Figure 4. Innate memory signature in S. aureus challenged dermal Mφ.
(A) Heat map depicting differentially expressed genes between PBS and S. aureus treated Ccr2-/- mice 3 weeks after infection. Total CD64hi macrophages were sorted from ear skin as described in Figure 1—figure supplement 1A. (B) Gene ontology analysis of overrepresented terms in PBS vs S. aureus infected mice. (Data represents three biological replicates per condition in one experiment). Genes with a fold change above 2.0 and a student’s t test P value lower than 0.05 were analyzed using the Panther bioinformatics platform.

