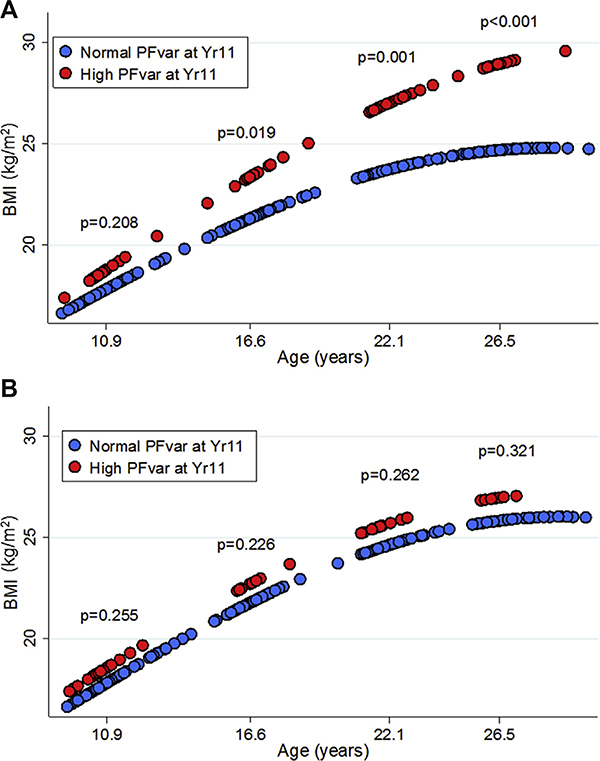
FIG 1.
Linear prediction of base 10 log-transformed BMI vs age for subjects with high (red circles) and normal (blue circles) PFvar at Yr11 after stratifying by sex (A: females; B: males). Linear predictions were calculated from random-effects models adjusted for maternal and paternal education, and ethnicity as fixed effects and current asthma, atopy, and metabolic equivalents of task at each survey as time-dependent covariates. P values related to group differences at each time point were tested using linear contrast.

