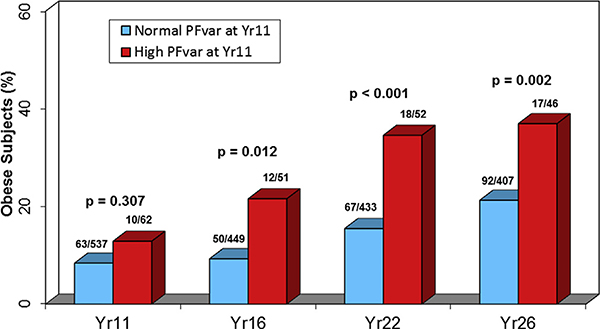
FIG E1.
Proportions of obese children at the 4 surveys by PFvar at age 11 years. P values related to group differences at each time point were tested using linear contrast from longitudinal Generalized estimating equation univariate analyses with PFvar at Yr11 as the independent variable and obesity at Yr11, Yr16, Yr22, and Yr26 as the dependent variable.

