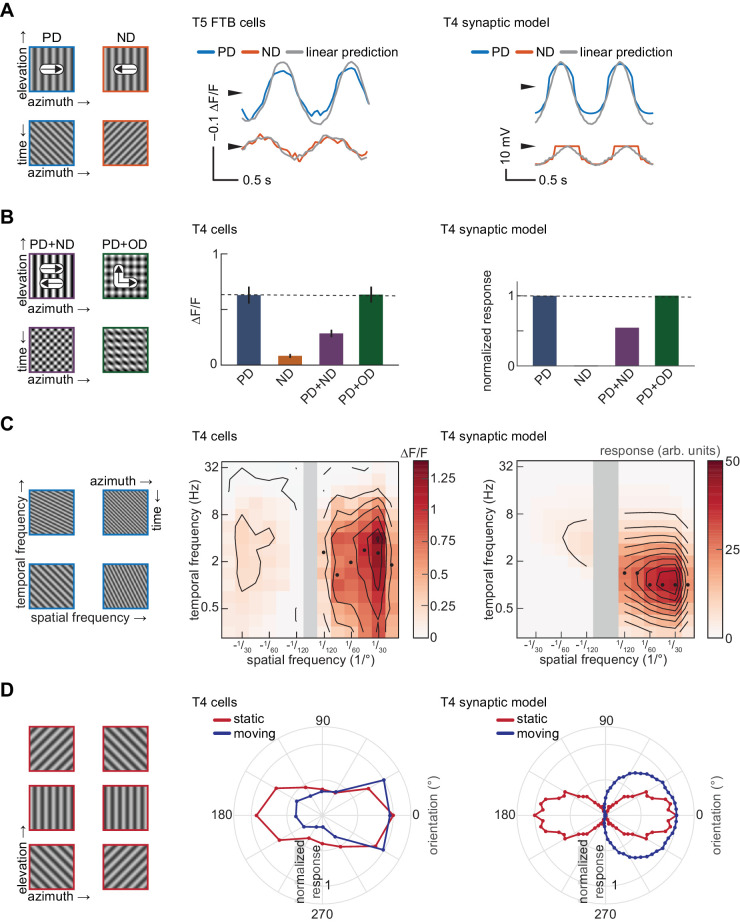
Figure 2.
The T4 synaptic model reproduces sinusoidal grating responses measured in T4 cells. (A) Left: Images and kymographs of sinusoid gratings drifting in the preferred (PD) and null (ND) directions. Center: Membrane voltage of T5 FTB cells to 1 Hz, 25° drifting gratings compared with linear predictions from contrast-modulated counterphase gratings, measured using voltage indicators (data from Wienecke et al., 2018). Right: As at center, but for voltage responses of the T4 synaptic model. The model has coefficients of determination for PD and ND of 0.92 and 0.82. (B) Mean responses to 1 Hz, 45° sinusoid gratings. Left: Images and kymographs of composite sinusoid gratings containing PD and ND motion or PD and orthogonal direction (OD) motion. Center: Mean responses of T4 cells to drifting gratings, measured using a calcium indicator (data from Badwan et al., 2019). Error bars indicate ±1 SEM. Right: As at center, but for calcium responses of the T4 synaptic model. (C) Spatiotemporal frequency tuning. Left: Kymographs of sinusoid gratings with varying spatiotemporal frequency content. Center: Spatiotemporal frequency tuning of T4 cells (data from (Creamer et al., 2018)). Black circles indicate the temporal frequency at which the maximum response at a given spatial frequency is attained. Right: As at center, but for the T4 synaptic model. (D) Orientation and direction tuning. Left: Images of oriented sinusoid gratings. Center: Orientation tuning of T4 and T5 cells with static gratings (data from (Fisher et al., 2015)) and direction tuning of T4 cells with drifting gratings (data from Maisak et al., 2013). The orientation of a static grating is defined by the vector normal to the apparent edges, the same definition as for moving gratings (see Appendix A). Right: As at center, but for the T4 synaptic model.

