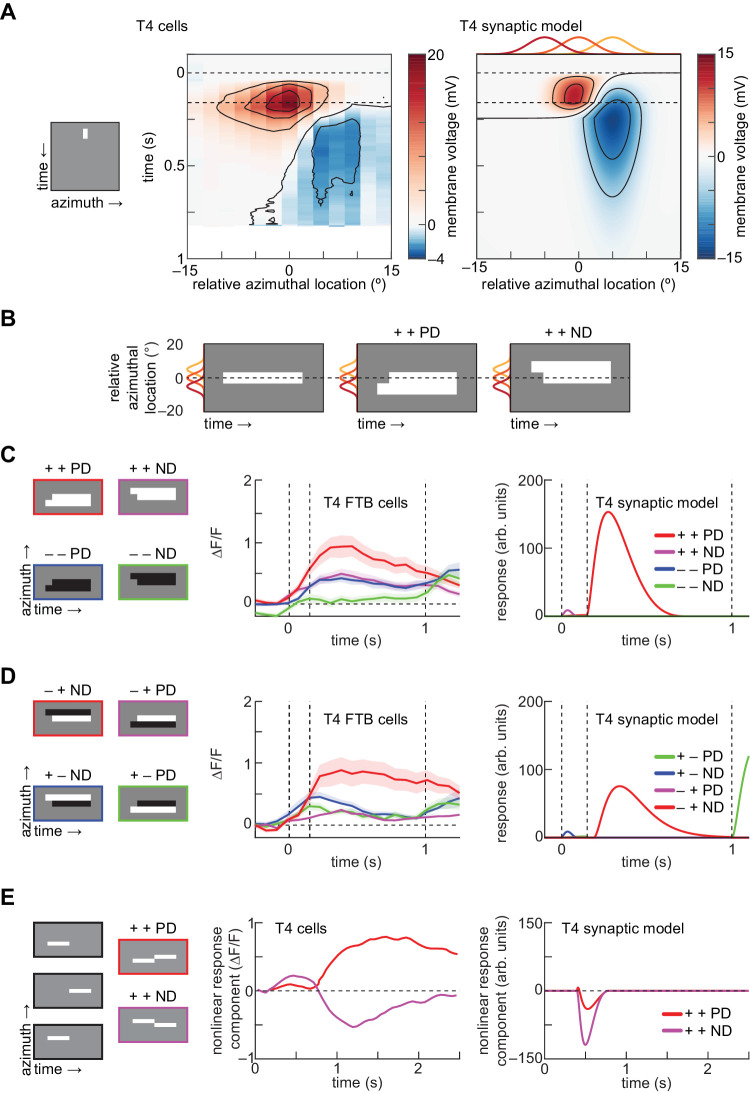
Figure 3.
The T4 synaptic model reproduces the spatial organization and selectivity of apparent motion responses in T4 cells. (A) Responses to a single white bar flashed at different spatial locations. Left: Kymograph of 2-degree white bar presented for 160 ms. Center: Membrane voltage of T4 cells to flashed white bars, measured using electrophysiology (data from Gruntman et al., 2018). Right: As at center, but for the T4 synaptic model. Red, orange, and yellow lines indicate the spatial acceptance functions of the 3 model inputs. (B) Apparent motion stimuli are aligned such that the lagging bar is located at the center of the receptive field (Salazar-Gatzimas et al., 2018). The leading bar is presented at time 0 and lasts for 1 second, and the lagging bar is presented 150 ms later. Each bar subtends 5 degrees of visual angle. Red, orange, and yellow lines indicate the spatial acceptance functions of the 3 inputs. (C) Responses to phi apparent motion stimuli, aligned as in (B). Left: Kymographs of all four possible phi apparent motion stimuli. Center: Responses of T4 FTB cells to all 4 phi apparent motion stimuli, measured using 2-photon calcium imaging (data from Salazar-Gatzimas et al., 2018). Error patches indicate ±1 SEM. Right: As at center, but for the T4 synaptic model. (D) As in panel C, but for reverse-phi apparent motion stimuli, in which the sequentially presented bars have opposite contrasts. (E) Assessing PD enhancement and ND suppression. Left: Kymographs of linear decomposition of flashed apparent motion stimuli, with 4.5-degree–wide white bars presented sequentially for 400 ms each. Center: Nonlinear response component, defined as the residual of the linear prediction, measured using a calcium indicator (data from (Haag et al., 2016)). Right: As at center, but for the T4 synaptic model.

