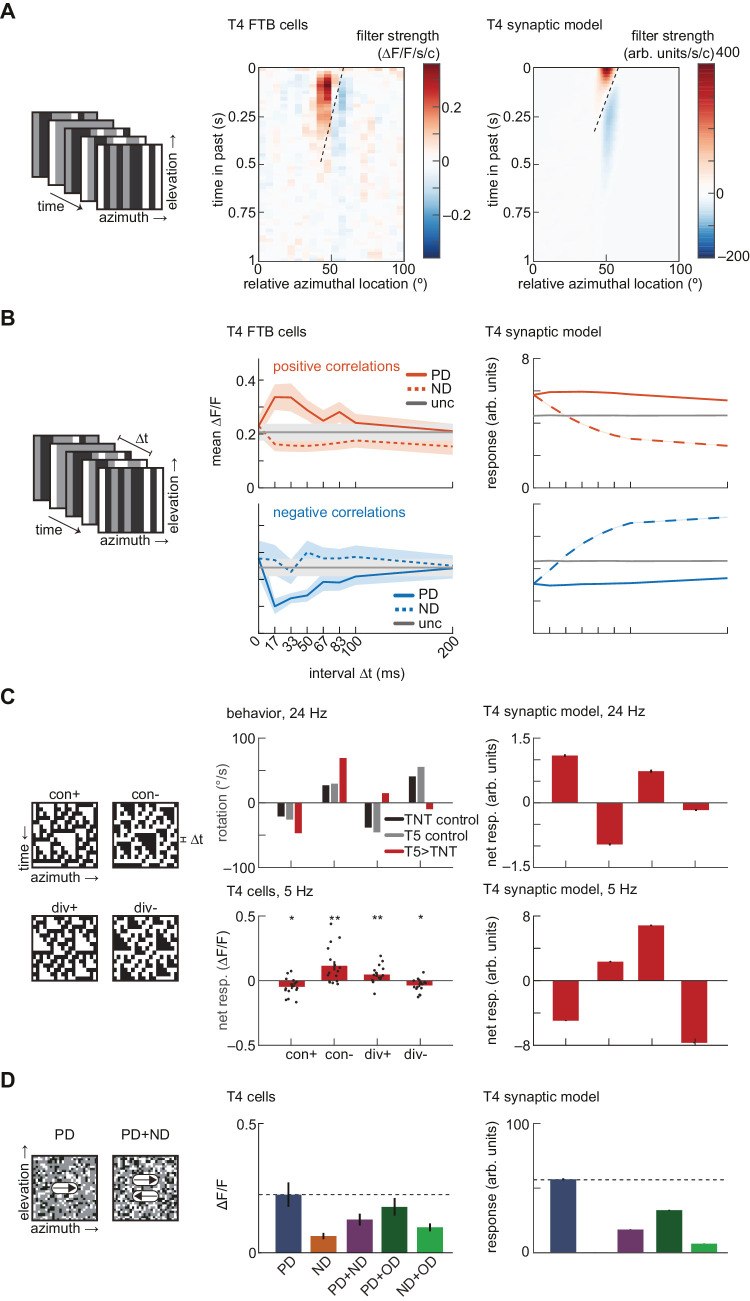
Figure 4.
The minimal T4 synaptic model is not sufficient to reproduce the fast-timescale tuning of T4 cells. (A) Linear receptive field measurements. Left: Schematic depiction of binary, uncorrelated spatiotemporal noise. Center: Linear receptive field of T4 FTB cells (data from Salazar-Gatzimas et al., 2016). Right: As at center, but for the T4 synaptic model. (B) Correlation interval receptive field measurements. Left: Schematic depiction of ternary noise containing pairwise correlations at a specified interval Δt. Center: Responses of T4 FTB cells to positive and negative correlations, measured using a calcium indicator (data from Salazar-Gatzimas et al., 2016). Error bars indicate ±1 SEM. Right: As at center, but for the T4 synaptic model. Error patches, which are barely visible, indicate 95% confidence intervals of the mean, which is variable due to the stochastic stimulus. (C) Triplet correlation sensitivity. Left: Kymographs of 3-point glider stimuli containing positive and negative triplet correlations. Center top: Turning behavioral responses to 3-point gliders updated at 24 Hz of flies with the synaptic outputs of T5 cells silenced (data from Leonhardt et al., 2016). Positive rotations correspond to the direction of the displacement of the spatial mean location of each triplet. Center bottom: Net responses of T4 cells to 3-point gliders updated at 5 Hz, measured using a calcium indicator (see Methods). Asterisks indicate that median net response differs from zero at the p < 0.05 (*) or p < 0.01 (**) level by a Wilcoxon signed-rank test with N = 16 flies. Exact p values are p = 0.0174, 0.0061, 0.0097, and 0.0131 for con+, con−, div+, and div−, respectively. Error bars indicate ±1 SEM over flies, and black circles indicate individual per-fly means. Right: As at center, but for the T4 synaptic model. Error bars indicate 95% confidence intervals of the mean. (D) Responses to rigidly translating stimuli with stochastic checkerboard patterns. Left: Images of random checkerboard stimuli. Center: Mean responses of T4 cells to checkerboard stimuli translating at 100 degrees/s, measured using a calcium indicator (data from Badwan et al., 2019). Error bars indicate ±1 SEM. Right: As at center, but for the T4 synaptic model. Error bars indicate 95% confidence intervals of the mean.

