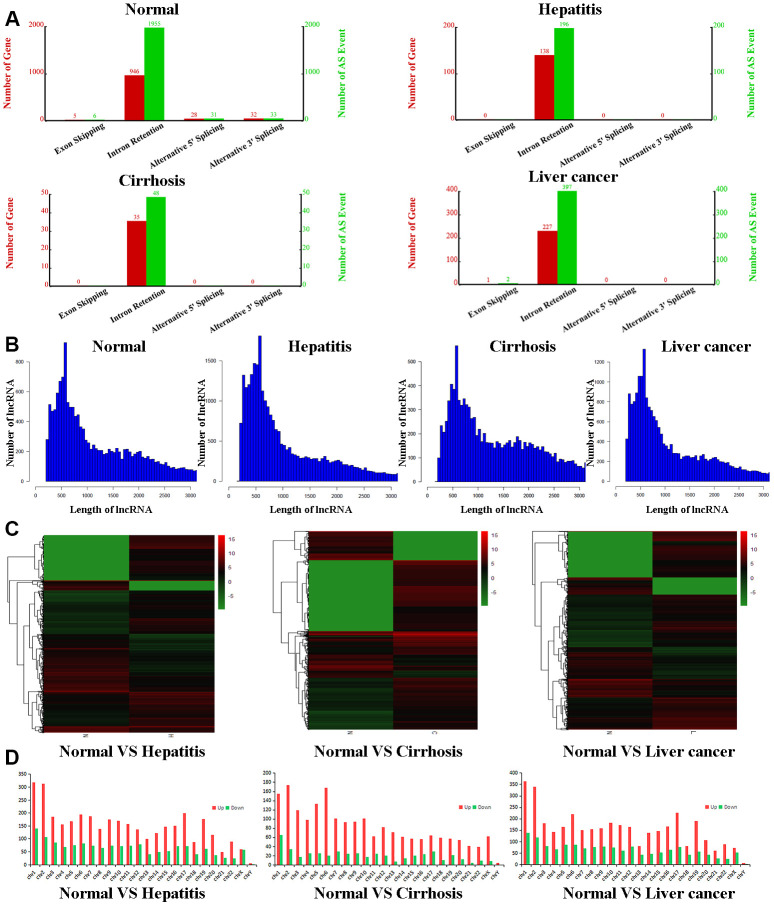
Figure 1.
Bioinformatic analyses of lncRNAs. (A) Number of genes (red) and alternate splicing events (green) for lncRNAs from control, hepatitis, cirrhosis, and HCC groups. (B) Length distribution of lncRNAs in control, hepatitis, cirrhosis, and HCC groups. (C) Cluster heatmaps of lncRNA expression profiles in the control group compared to hepatitis, cirrhosis, and HCC groups. Gradient green represents downregulated lncRNAs, while gradient red represents upregulated lncRNAs. (D) Chromosomal distributions of lncRNAs in the control group compared to hepatitis, cirrhosis, and HCC groups. lncRNA, long noncoding RNA; HCC, hepatocellular carcinoma.

