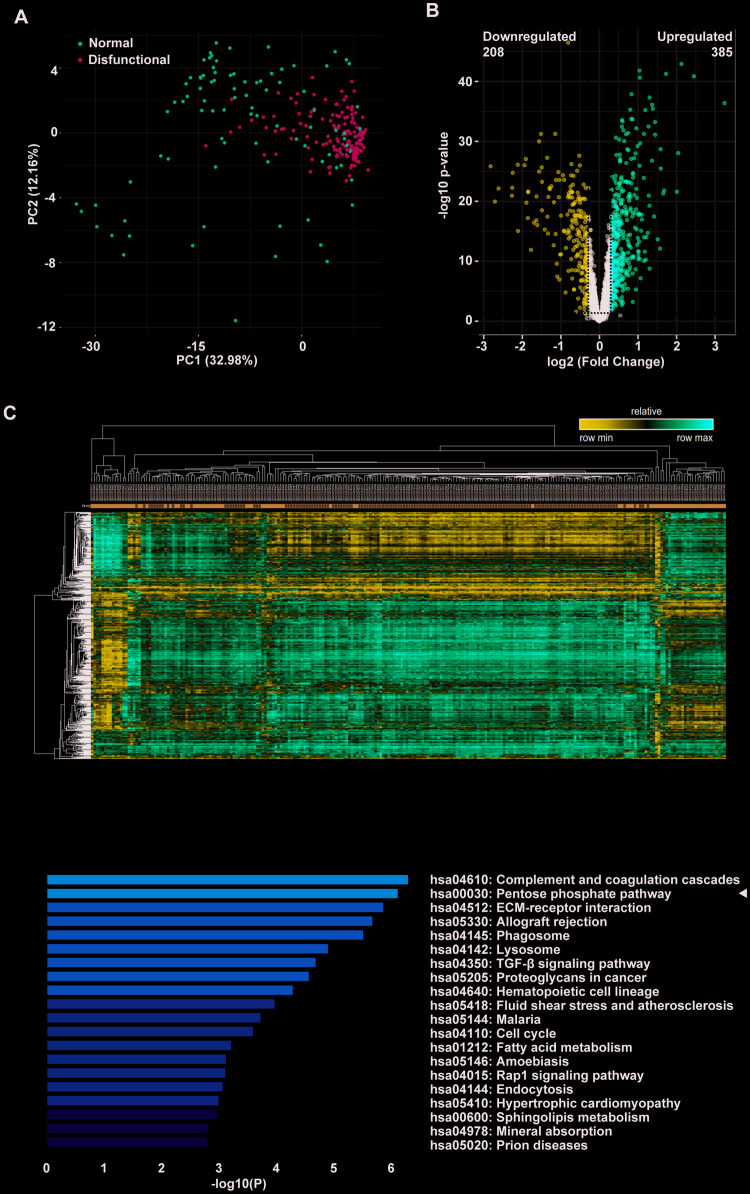
Figure 1.
The pentose phosphate pathway is enriched in tracheal transplantation allografts. (A) Principal component analysis (PCA) plot of clinically-normal and -dysfunctional lung transplant biopsies in this dataset. The red dots represent the normal group while the green dots represent the dysfunctional group. (B) Volcano plot showing DEGs with p < 0.01 and fold change > 1.23; a total of 385 upregulated genes are represented by the red dots and 208 downregulated genes are represented by the blue dots. The black dots corresponds genes whose expression did not change. (C) Heatmap of lung transplant biopsies between the two indicated groups was obtained by unsupervised hierarchical clustering of DEGs and samples. Red indicates increased gene expression, whereas blue indicates decreased gene expression. (D) KEGG pathway enrichment of upregulated DEGs. The shades of the yellow bar correspond to -log10 (P), and the pentose phosphate pathway shows enrichment.

