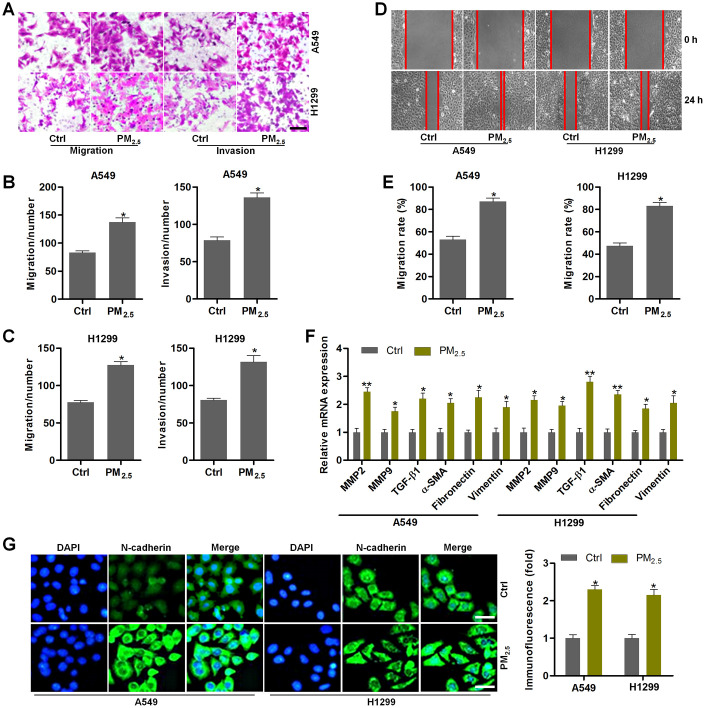
Figure 6.
PM2.5 contributes to the migration and invasion of NSCLC cells. (A–G) Th17 cells were exposed to 100 μg/cm2 of PM2.5 for 24 h. Then, the obtained medium was collected, and mixed with fresh RPMI1640 absolute medium at 1:3 dilutions. Next, A549 and H1350 cells were treated with the composed culture medium for another 24 h. Subsequently, all cells were collected for the following analysis. (A) Transwell analysis was used to determine the migration and invasion of lung cancer cells. Scale bar, 100 μm. (B, C) Quantification of the number of cells in migration and invasion. (D) Wound healing analysis was performed to assess the migration of lung cancer cells. (E) The number of NSCLC cells in migration was quantified following wound healing analysis. (F) RT-qPCR analysis was used to calculate the mRNA expression levels of genes associated with EMT. (G) IF staining of N-cadherin in A549 and H1350 cells treated as indicated. Scale bar, 50 μm. All data are expressed as mean ± SEM. *p<0.05 and **p<0.01 compared to the Ctrl group.

