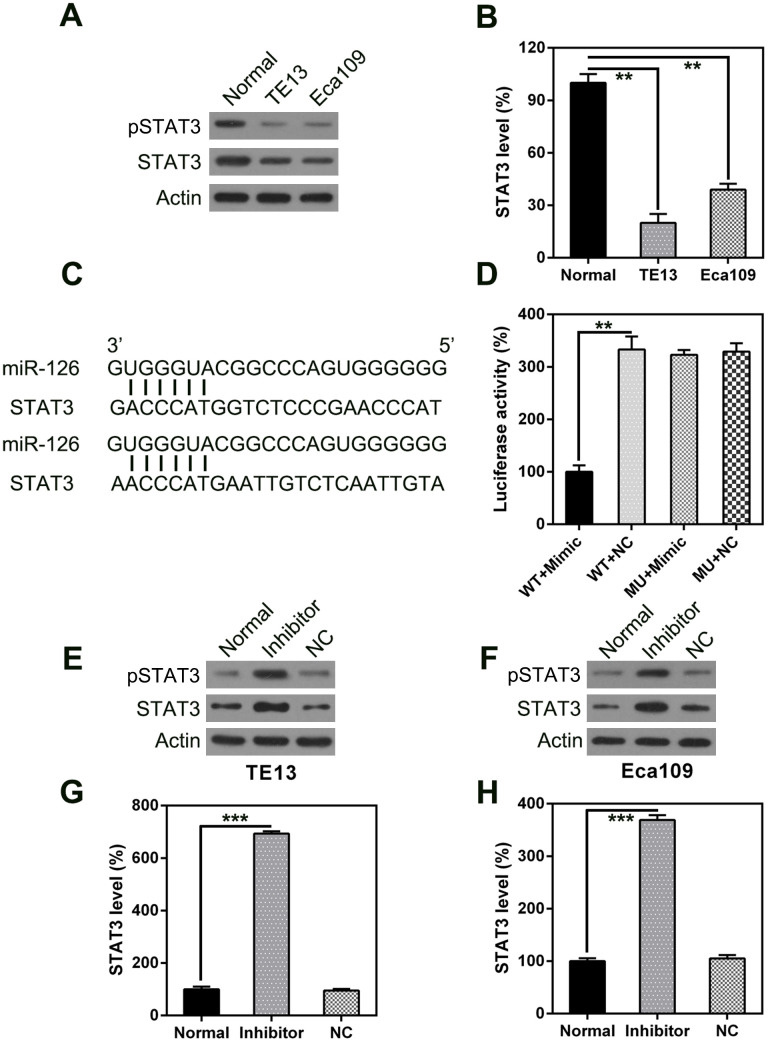
Figure 6.
STAT3 is a direct target of miR-126. WB (A) and qPCR (B) were used to measure STAT3 expression in ESCC cells. (C) Graphical illustration of the conservative miR-126 binding motif in the STAT3 3’-UTR. (D) DLRA with luciferase reporter constructs of WT or MU STAT3 3’-UTR following transfection with the miR-126 mimic. Luciferase activity was standardized to β-galactosidase. Treatment with the miR-126 mimic dramatically reduced the relative luciferase activity in the WT 3’-UTR. WB (E, F) and qPCR (G, H) were used to measure STAT3 protein and mRNA expression following transfection with miR-126 or NC inhibitors. Results are displayed as the average ± SD. *P < 0.05, **P < 0.01, and ***P < 0.001.

