
Figure 4.
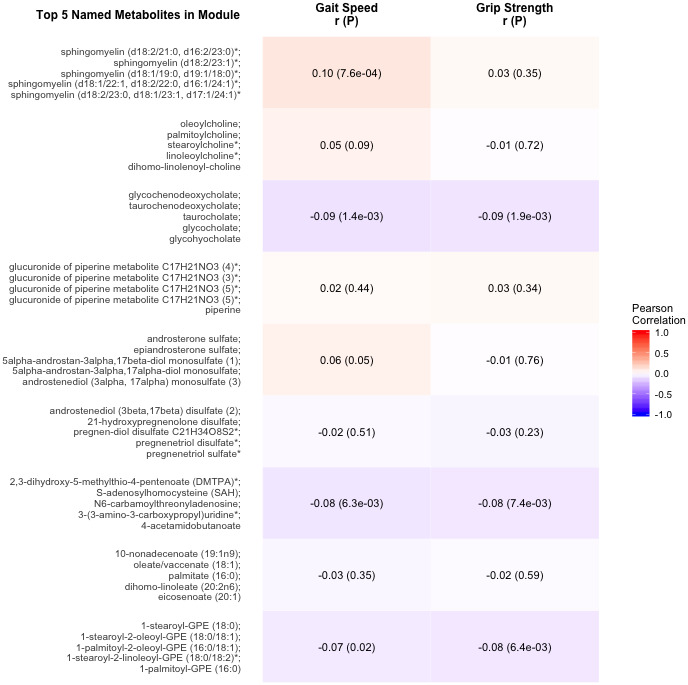
Correlations of metabolite modules with physical performance. Colors represent correlation strength, ranging from blue (-1) to red (1). * indicates compounds with Metabolomics Standards Initiative confidence level 2.
Official websites use .gov
A
.gov website belongs to an official
government organization in the United States.
Secure .gov websites use HTTPS
A lock (
) or https:// means you've safely
connected to the .gov website. Share sensitive
information only on official, secure websites.
Correlations of metabolite modules with physical performance. Colors represent correlation strength, ranging from blue (-1) to red (1). * indicates compounds with Metabolomics Standards Initiative confidence level 2.