Figure 3.

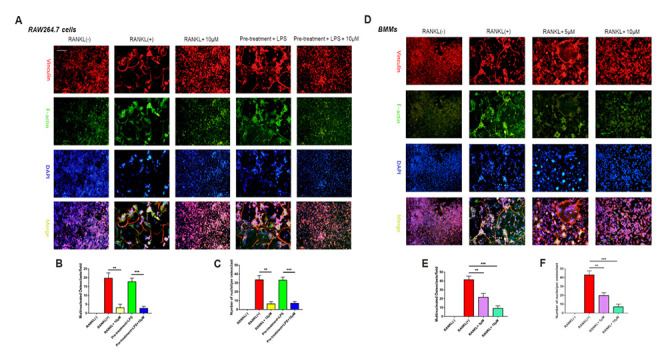
Epothilone B made an inhibitory effect on osteoclast fusion significantly. (A) Representative images of FAK staining of RAW264.7 cells induced by RANKL or LPS with or without Epothilone B treatment. Scale bar = 200 μm. (B–C) Quantitative analysis of multinucleated osteoclasts (nuclei≥3) and average the number of multinucleated osteoclasts. (D) Representative images of FAK staining of BMMs induced by RANKL in the presence or absence of various concentrations of Epothilone B. Scale bar = 200 μm. (E–F) Quantitative analysis of multinucleated osteoclasts (nuclei≥3) and average the number of multinucleated osteoclasts. Data in the figures represent mean ± SD. *p < 0.05, **p < 0.01, ***p < 0.001 based on one way ANOVA.
