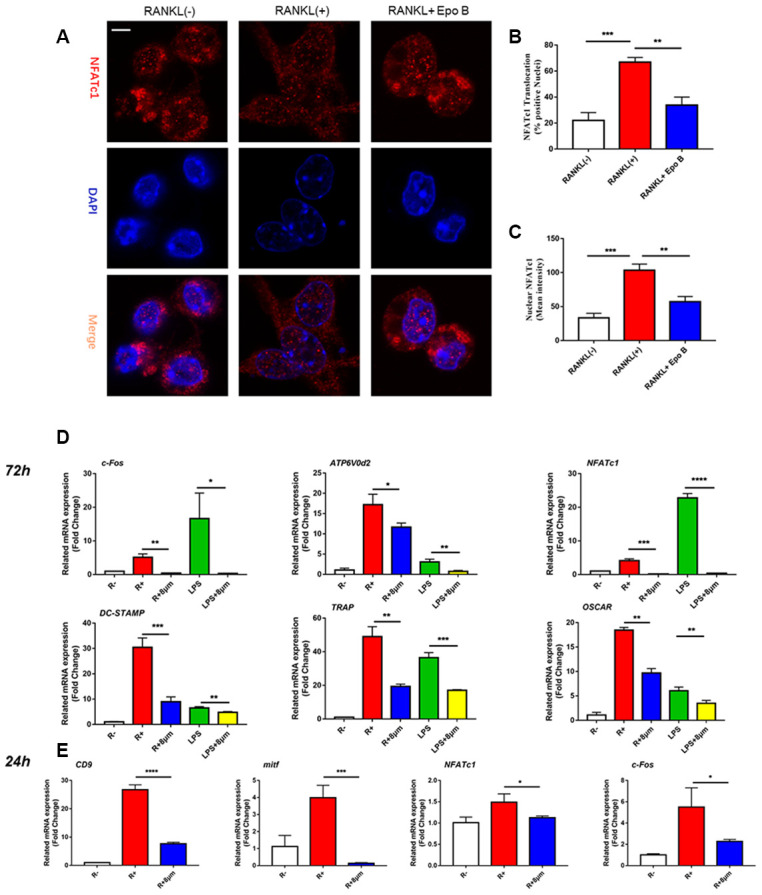
Figure 4.

Epothilone B suppressed NFATc1 nuclear translocation and the expression of marker genes during osteoclastogenesis. (A) Representative images of immunofluorescence staining of the nuclear translocation of NFATc1 in the absence of presence of Epothilone B. Scale bar = 800 μm. (B) Quantitative analysis of the percentage of positive cells (NFATc1 translocation from cytosol to nuclear) in all cells. (C) Quantitative analysis of the mean intensity of NFATc1 in the cells nuclear. (D) Relative expression of marker genes in the procedure of osteoclastogenesis from monocytes to mature osteoclasts on mRNA level. (E) Relative expression of marker genes in the early stage of osteoclastogenesis on mRNA level.
