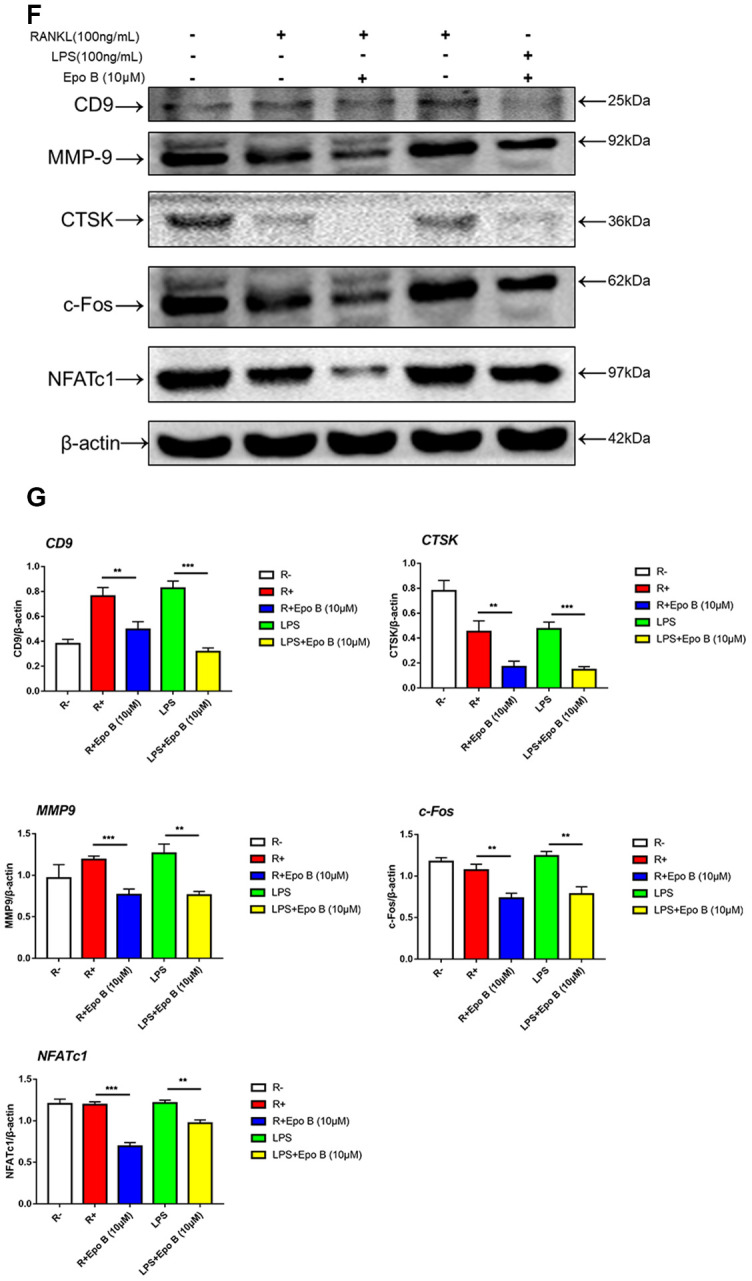
Figure 4.

Epothilone B suppressed NFATc1 nuclear translocation and the expression of marker genes during osteoclastogenesis. (F) Relative expression of marker genes in the procedure of RANKL or LPS induced osteoclastogenesis on protein level. (G) Quantification of CTSK, MMP9, c-Fos, NFATc1 and CD9 relative to β-actin. Data in the figures represent mean ± SD. N.S. represented no significant difference. *p < 0.05, **p < 0.01, ***p < 0.001 based on one way ANOVA.
