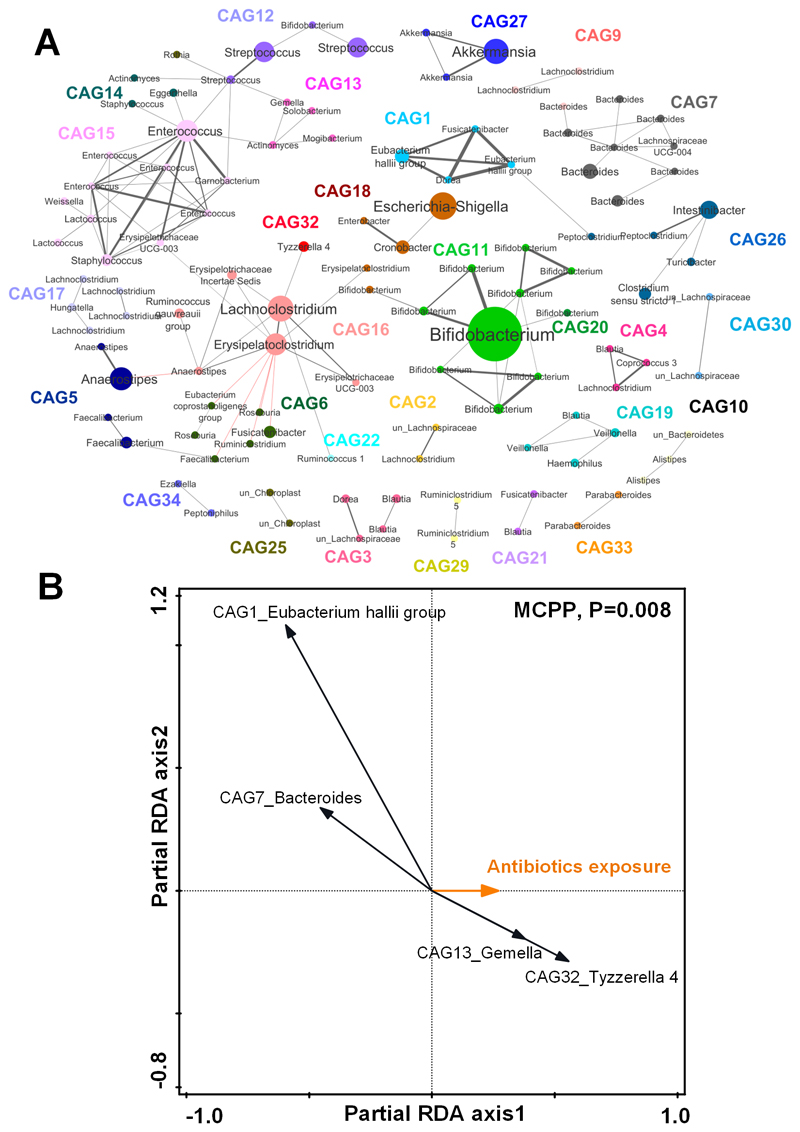
Figure 1. Co-abundant network analysis of the child gut microbiota at 24 months and key co-abundant groups associated with the antibiotic exposure by partial redundancy analysis (partial RDA).
A) Co-abundant network highlighting relationships between OTUs of the child gut microbiota at 24 months. Each node represents one OTU. Nodes with the same color are from the same co-abundant group (CAG). Node size indicates the average abundance of each OTU in this cohort. The taxonomy of each OTU is labeled. The OTU with the highest relative abundance in each CAG was selected as the representative OTU. Grey and red lines show significant positive and negative correlations between two OTUs with an absolute coefficient value greater than 0.3. B) Partial RDA biplots illustrating the key CAGs associated with the effects of antibiotic exposure after adjusting for the covariates. The number of antibiotic courses infants received in the first year of life was used as the exposure variable. Secreting status, delivery mode, duration of breastfeeding and birth weight were all used as covariates. CAGs that explained ≥ 1% of the variability of samples on the first axis are indicated by arrows. The significance of the effects of the antibiotic exposure was tested using the Monte-Carlo Permutation Procedure (MCPP).

