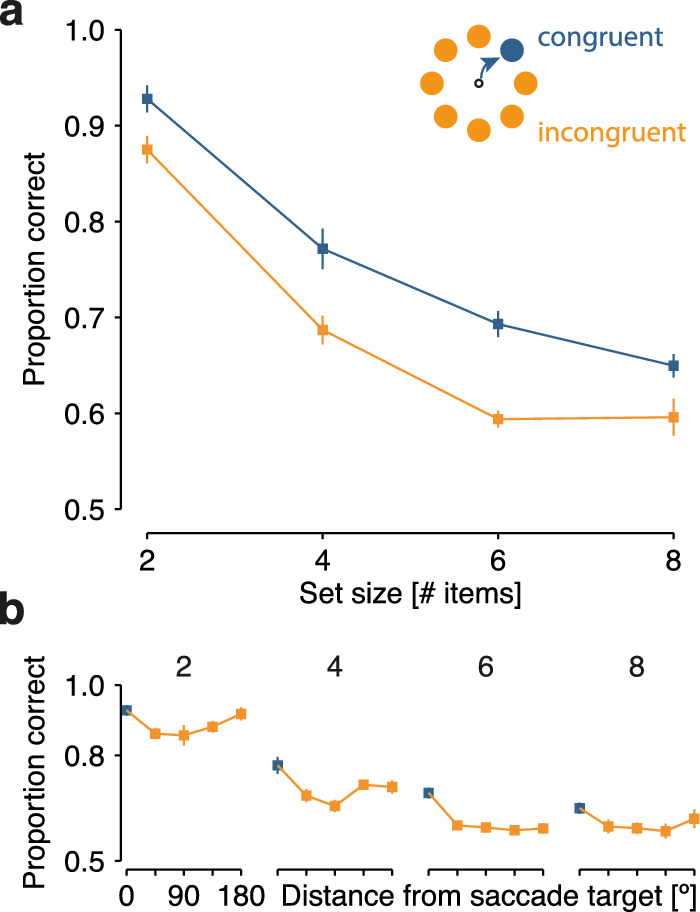
Figure 2.

Results of Experiment 1. (a) Mean performance ±1 within-subject SEM in congruent (blue) and incongruent (orange) trials is displayed as a function of set size (2, 4, 6, or 8 items in the memory array). (b) Spatial specificity of the saccadic influence on visual memory performance. Mean performance ± 1 SEM is shown as a function of angular distance between the memory probe location and the saccade target in the array, plotted separately for each memory set size. SEM, standard error of the mean.
