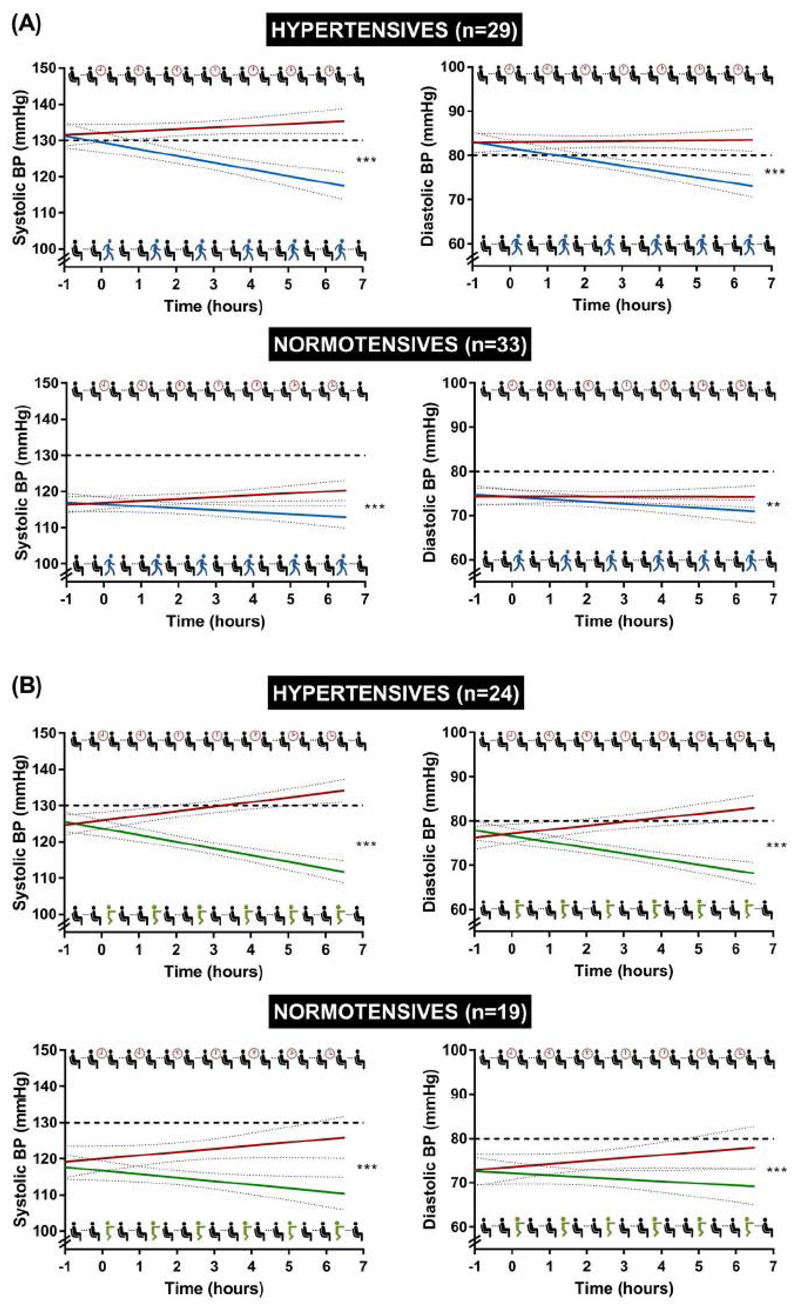
Figure 2.
Temporal changes in systolic and diastolic BP of pooled data from four separate crossover trials39, 43, 73, 85 employing similar experimental protocols in individuals with and without hypertension. (A) Lines represent line of best fit (with 95% CI, dotted lines) for uninterrupted sitting (red line) and sitting interrupted with short 2-3 minute walking breaks (blue line) every 20-30 minutes after a 1-hour steady-state period. (B) Lines represent line of best fit (with 95% CI, dotted lines) for uninterrupted sitting (red line) and sitting interrupted with short 3 minute simple resistance activities (green line) every 30 minutes after a 1-hour steady-state period. Hypertensive individuals defined by a combination of clinical diagnosis/medication use, or BP ≥130/80 mmHg at screening visit. Solid dashed line represents new US clinical thresholds for hypertension (>130/80 mmHg)1. Difference in slopes according to a linear mixed effect model adjusted for age, sex, BMI, treatment order and baseline values, ***P<0.001, **P=0.002 (see Supplementary Table S2 for further details on the statistical models/results).

