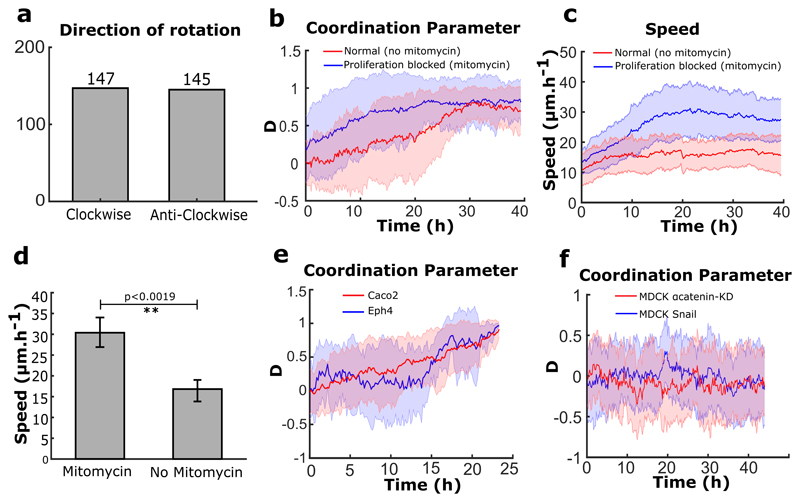
Extended Data Figure 1. Characterization of collective rotation in different conditions and different cell lines.
a, Distribution of rotation direction in rings (n=292, m=10). b, c, Coordination parameter and rotation speed evolution over time in the rings for cells under normal conditions (no-mitomycin, n=46,m=3) or proliferation blocked (with mitomycin, n=62,m=3) condition. The plateau corresponds to the emergence of a persistent rotation. d, Average speed of rotation for mitomycin treated (n=62, m=3) and untreated cells (n=46, m=3). e, Coordination parameters for different cell lines, Eph4 (n=10) and Caco2 (n=30). f, Coordination parameters D for MDCK-α-catenin-KD cells (n=30) and MDCK-Snail-1 over expressing cells (n=30). All error bars indicated are standard deviations.

