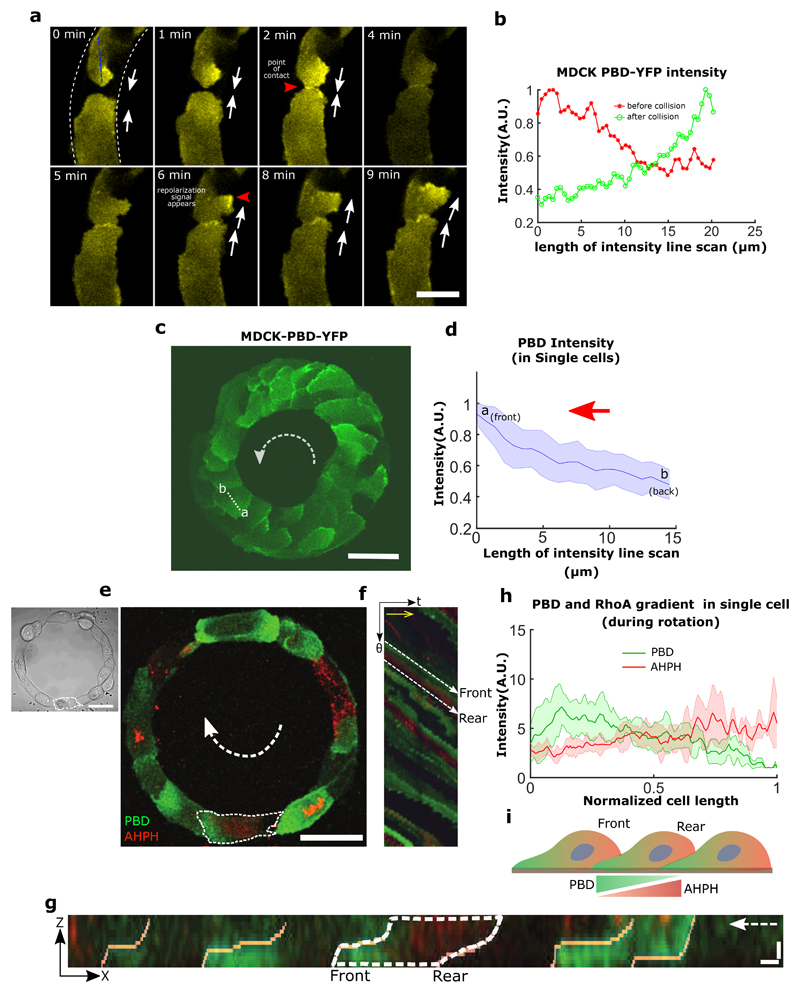
Extended Data Figure 2. Repolarization time scale of single cell and single cell polarities.
a-b, Spatio-temporal montage of MDCK-PBD-YFP cells showing repolarization of a single cell upon collision. White arrows (dashed) show the direction of cell migration. Red arrow heads indicate the time of the collision (at 2 min.) and the appearance of Rac1 repolarization signal (at 6 min.), respectively. c, Confocal image of basal plane in a 50 μm wide ring shows a PBD gradients in all the cells indicating cell scale polarized Rac1 activities. d, Line intensity profile (as visualized by PBD biosensor intensity) shows average Rac1 gradient of single cells (n=42 from 2 rings, m=2) from multiple rings (as represented in a single cell marked by line -ab in panel c). e, MDCK cells expressing YFP-PBD and mcherry-AHPH. f, Saptio-temporal kymograph shows the single cells (marked with white dashed line) retain the front-rear characteristics during rotations. g, Distribution of AHPH (red) and PBD (green) at single cell level from the orthogonal view at one time point. Typical example of a single cell with boundaries marked in dashed white line (XZ scale bar: 2 μm). h, Line graph showing the intensity distribution of PBD and AHPH in single cells (n= 5 cells) of a rotating ring. i, Schematics showing the gradient of PBD and AHPH in single cells of a train. All error bars indicated are standard deviations. All scale bars unless mentioned specifically: 50 μm.

