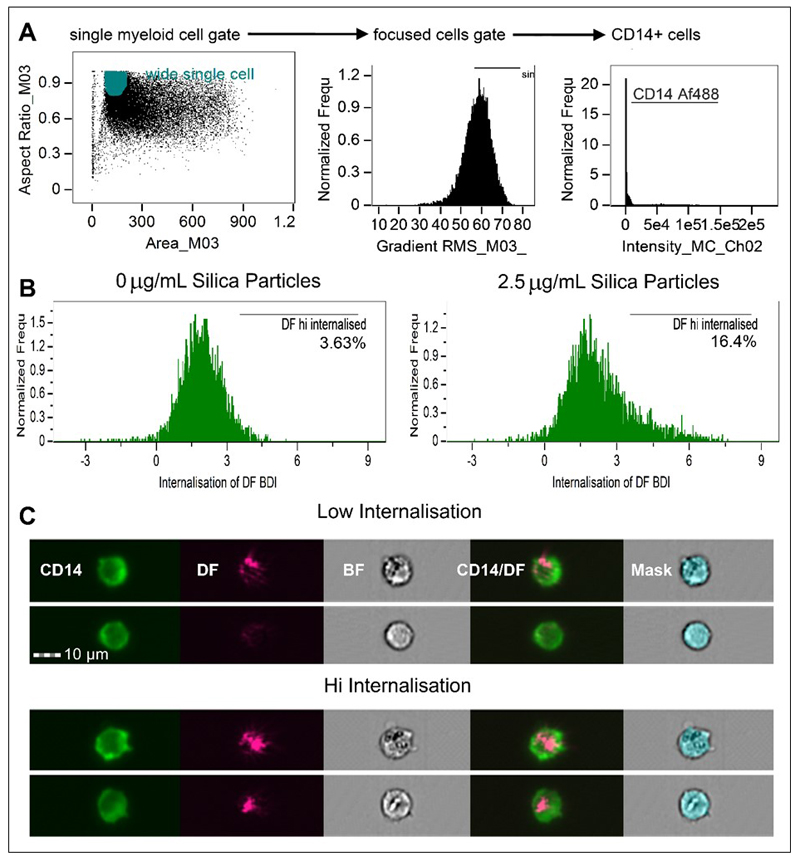
Figure 2. Analysis strategy and histogram plots of internalisation scores for Ch6 (Darkfield/SSC) and internalisation hi gates of gated CD14+ populations within PBMC.
A. Area (size of the masked cells in μm2) versus aspect ratio (of the minor axis divided by the major axis) of the brightfield cell images were used to draw an initial dot plot to identify cells of interest and exclude doublets and debris. From the single cell (phagocyte) gate, cells in best focus were gated (using gradient RMS), followed by gating on CD14+ positives using fluorescence intensity in Ch02. Examples are shown from the analysis of 1 subject. B. Using the single, focused, CD14+ gates, the IDEAS internalisation feature was utilised to create internalisation score histograms for the single, focused CD14+ gated cells. Internalisation hi gates were then drawn to establish the number of cells displaying highly internalised darkfield intensity signals. C. Representative example images of cells scoring as having high and low internalisation of particle.

