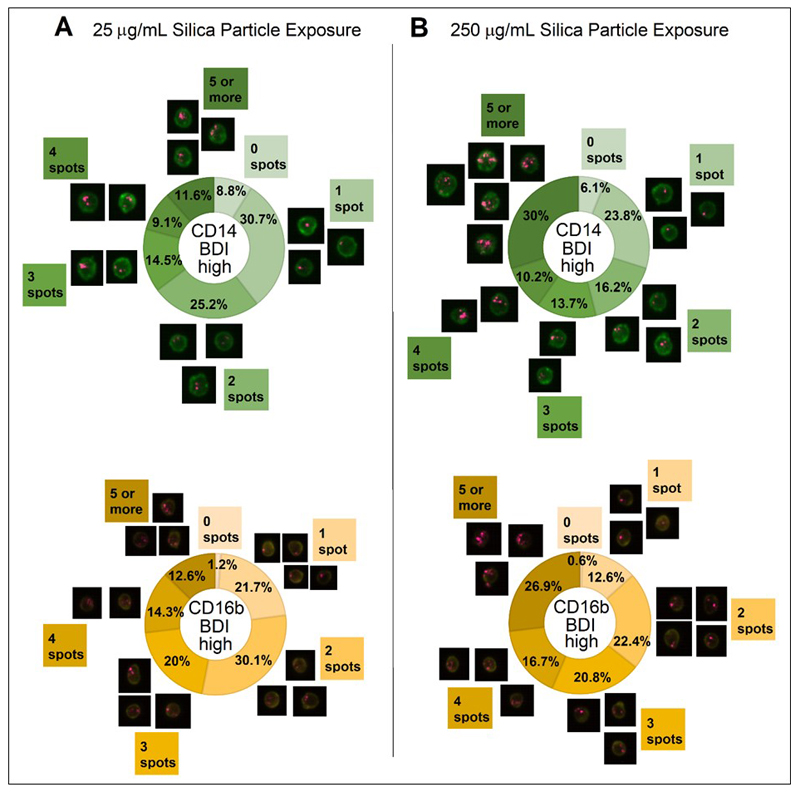
Figure 9. Crystalline silica particle loading of monocytes and neutrophils on a cell by cell basis.
Measurement of the number of individual bright spots in darkfield BDI appearing in cells after exposure to 25 and 250 μg/mL crystalline silica particles carried out using spot count analyses of the darkfield BDI high gated cells. Percentages of cells bearing 0, 1, 2, 3, 4 and 5 (or more) spots are displayed as doughnut charts with adjacent image examples for each segment for CD14+ monocytes (green) and CD16b+ neutrophils (yellow) exposed for 24 h to A. 25 μg/mL and B. 250 μg/mL crystalline silica particles in whole blood incubations (averaged data of n = 5 individual subjects). A significant difference in the number of spots between concentrations was assessed using Tukey’s honest significance test for multiple comparisons following a one way ANOVA.

