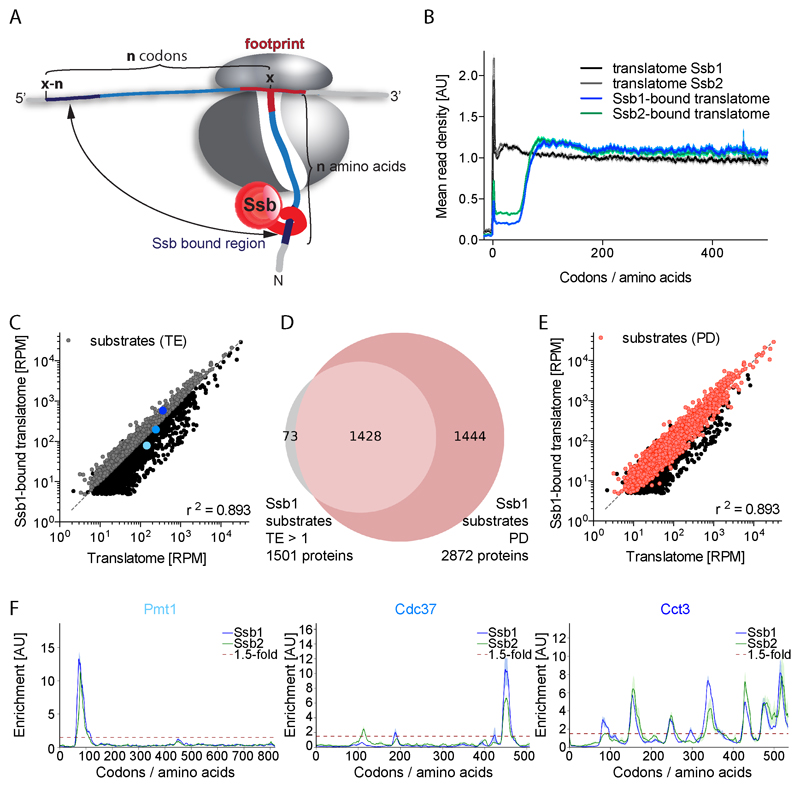
Figure 1. Nascent chain substrates of Ssb1 and Ssb2.
(A) Model illustrating the identification of Ssb binding positions. (B) Metagene profiles of translatomes and Ssb1- and Ssb2-bound translatomes. Shaded areas show the 95% confidence interval (CI). AU: arbitrary units. (C) and (E) Gene expression levels of translatome and Ssb1-bound translatome in reads per million (RPM). (C) Ssb1 substrates (grey) identified by total enrichment (TE >1). (E) Ssb1 substrates (red) identified by peak detection (PD). (D) Ssb1 substrate overlap detected by TE and PD. (F) Ssb1 and Ssb2 interaction profiles of proteins highlighted in (C). Shaded areas show the variation between replicates. n=2. See also Figures S1 and S2.

