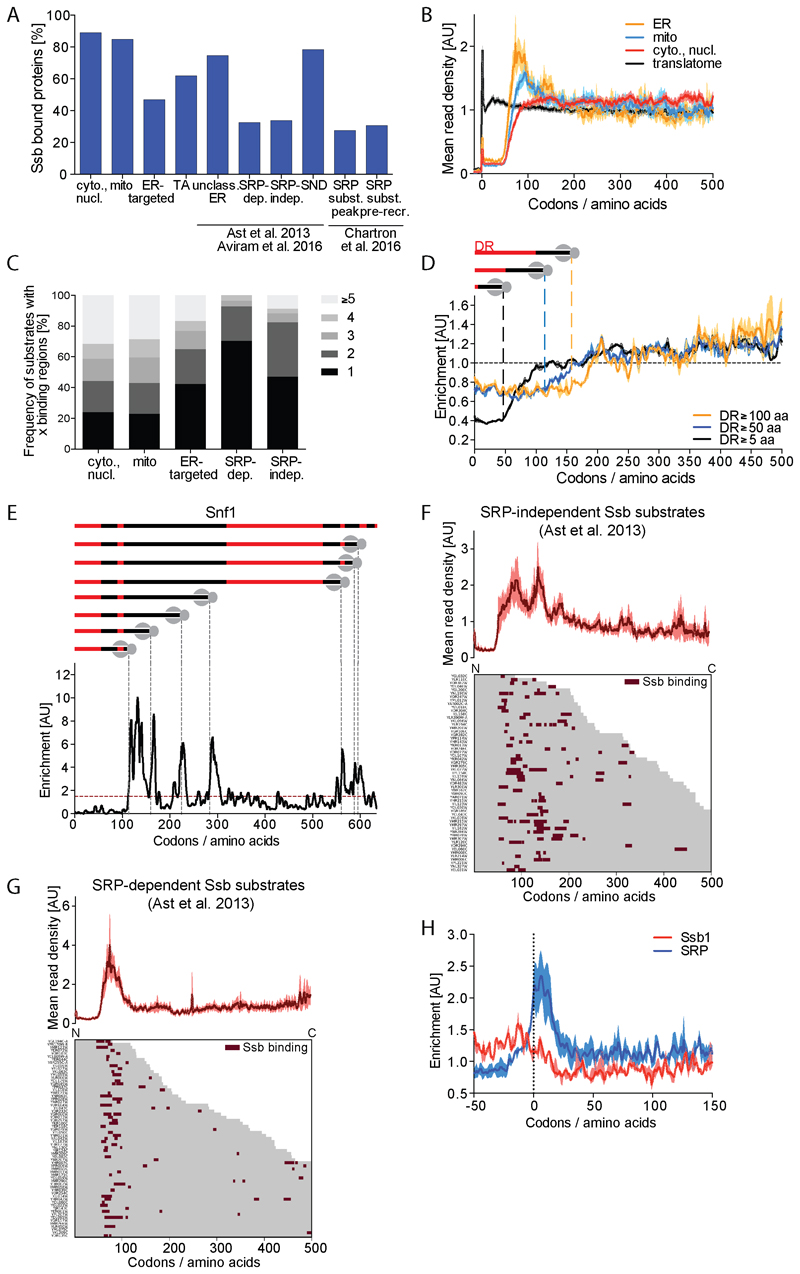
Figure 3. Subcellular destination of substrates affects Ssb interaction profiles.
(A) Fraction of Ssb substrates within indicated protein categories; cytoplasmic and nuclear, mitochondrial, ER-targeted, tail-anchored (TA), unclassified ER-targeted, SRP-dependent, SRP-independent, SND-pathway, SRP substrate (with defined SRP binding peak) and SRP substrate (with SRP pre-recruitment). (B) Metagene translatome and Ssb-bound translatomes with nascent proteins sorted by intracellular destination (averaged translatomes in black). Shaded areas indicate the 95% CI. (C) Number of Ssb binding regions per protein sorted by localization. (D) Metagene enrichment of Ssb binding to proteins containing disordered regions (DR) with indicated minimal lengths aligned to the start of first DR. Shaded areas indicate 95% CI. (E) Ssb binding to Snf1. Top: Position and length of DR (red) in Snf1. Gray dashed lines indicate onset of Ssb binding. Bottom: Ssb binding profile. (F, G) Heatmap of Ssb binding to ribosomes synthesizing SRP-independent (F) and SRP-dependent (G) nascent proteins. Corresponding metagene profile shown on top. (H) Metagene Ssb and SRP enrichment for genes with distinct SRP binding peak (Chartron et al., 2016) aligned to SRP peak position. Shaded areas show 95% CI. See also Figures S3, S4 and S7.

