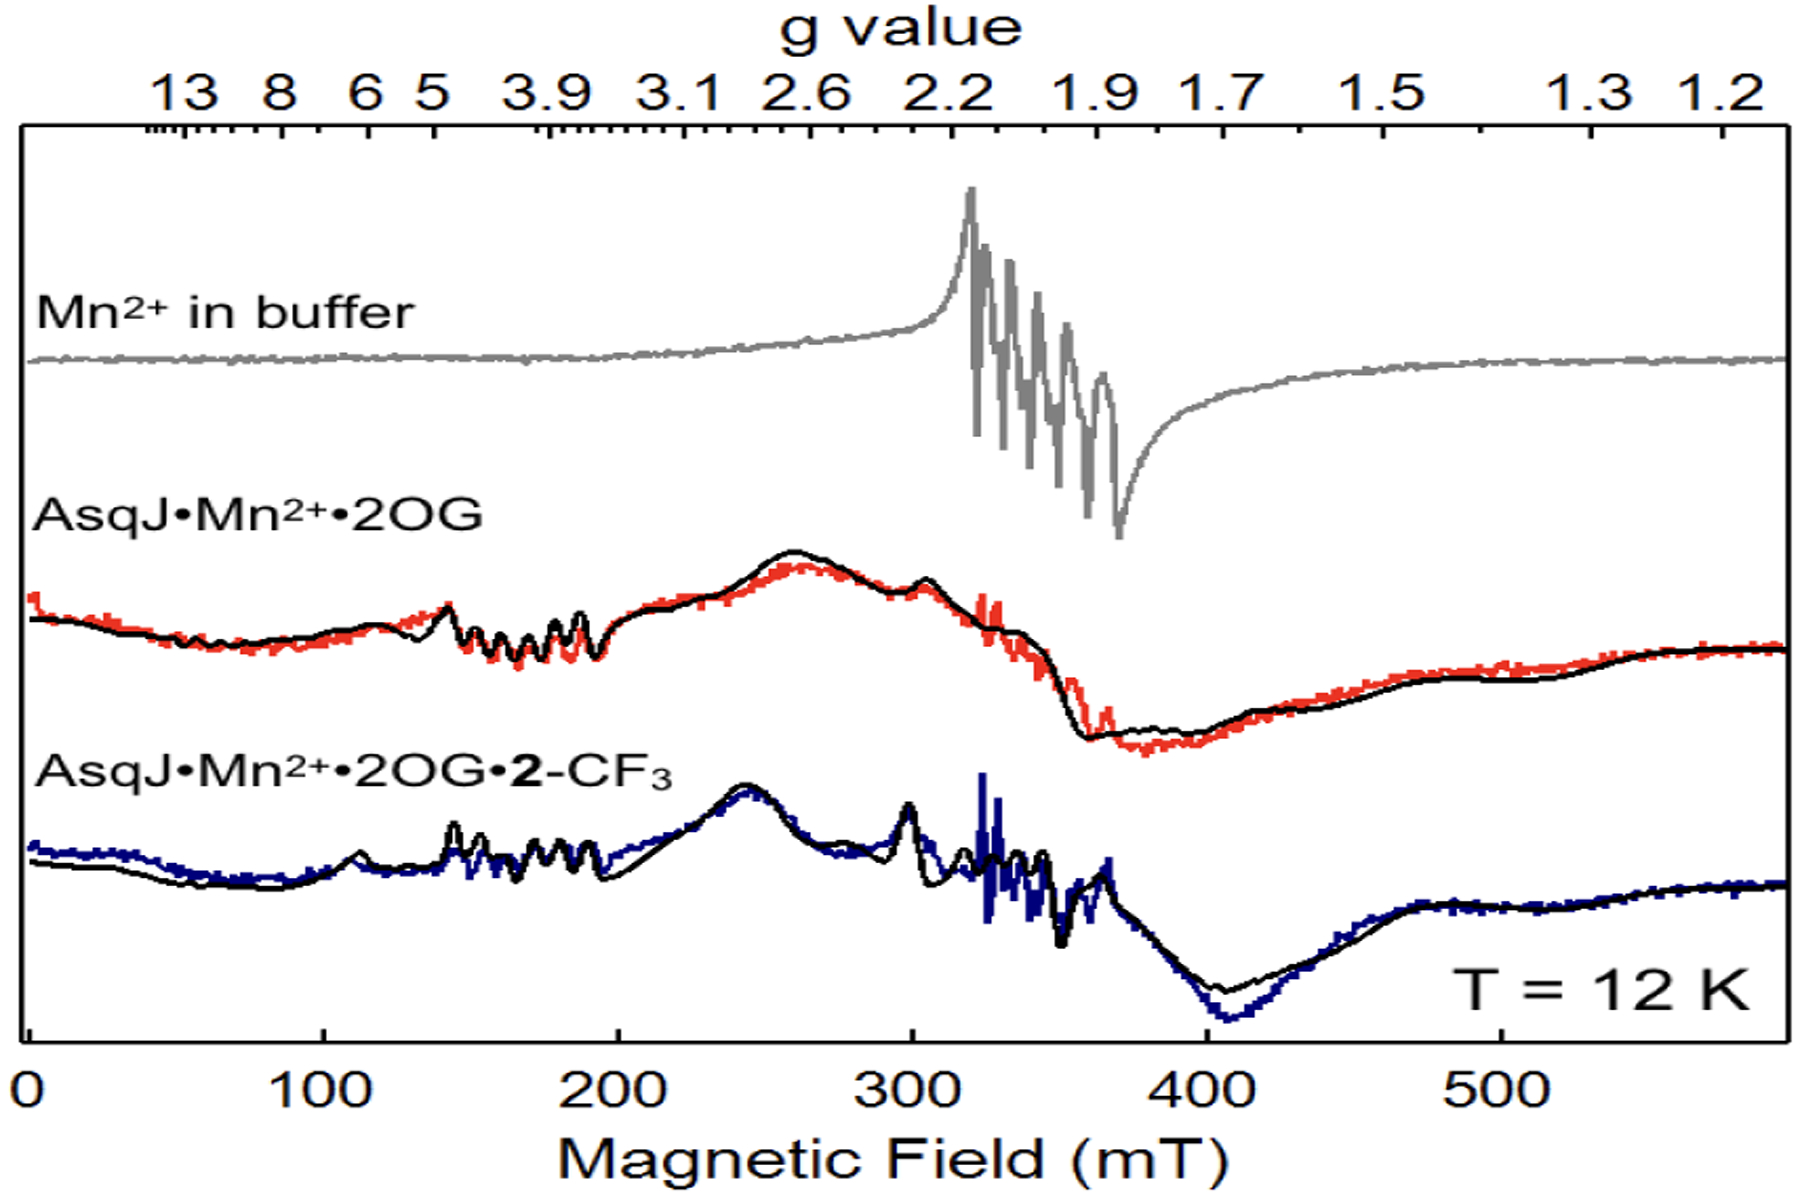
Figure 1.

X-band EPR signals from samples containing Mn2+ in buffer solution (top, grey), AsqJ⋅Mn2+⋅2OG ternary complex (middle, red), and AsqJ⋅Mn2+⋅2OG⋅2-CF3 quaternary complex (bottom, blue). The corresponding spectral simulations are shown in black curves. The simulation parameters are for S = 5/2, I = 5/2. For the ternary complex (middle), g = 2.03, D = 0.08 cm−1, E/D = 0.20, |AMn| = 243 MHz; for the quaternary complex (bottom), g = 2.02, D = 0.08 cm−1, E/D = 0.13, |AMn| = 254 MHz. Measurement conditions: microwave frequency, 9.64 GHz; microwave power, 20 uW; modulation frequency, 100 kHz; modulation amplitude, 1 mT; temperature, 12 K.
